Skip to content
free
K
1
2
practice
Home
Math
English
Science
Social Studies
Contact
Language
English
Español
Sign In
/
High School Electives
/
Speech & Debate
/
Graphs, Tables and Data Displays
Grade Level
Speech & Debate
SD.078 Graphs, Tables and Data Displays
0%
Skill Level
🔴 Hard
00:00
Progress to Next Level
25% to Medium
Easy
Medium
Hard
Mastery
100%
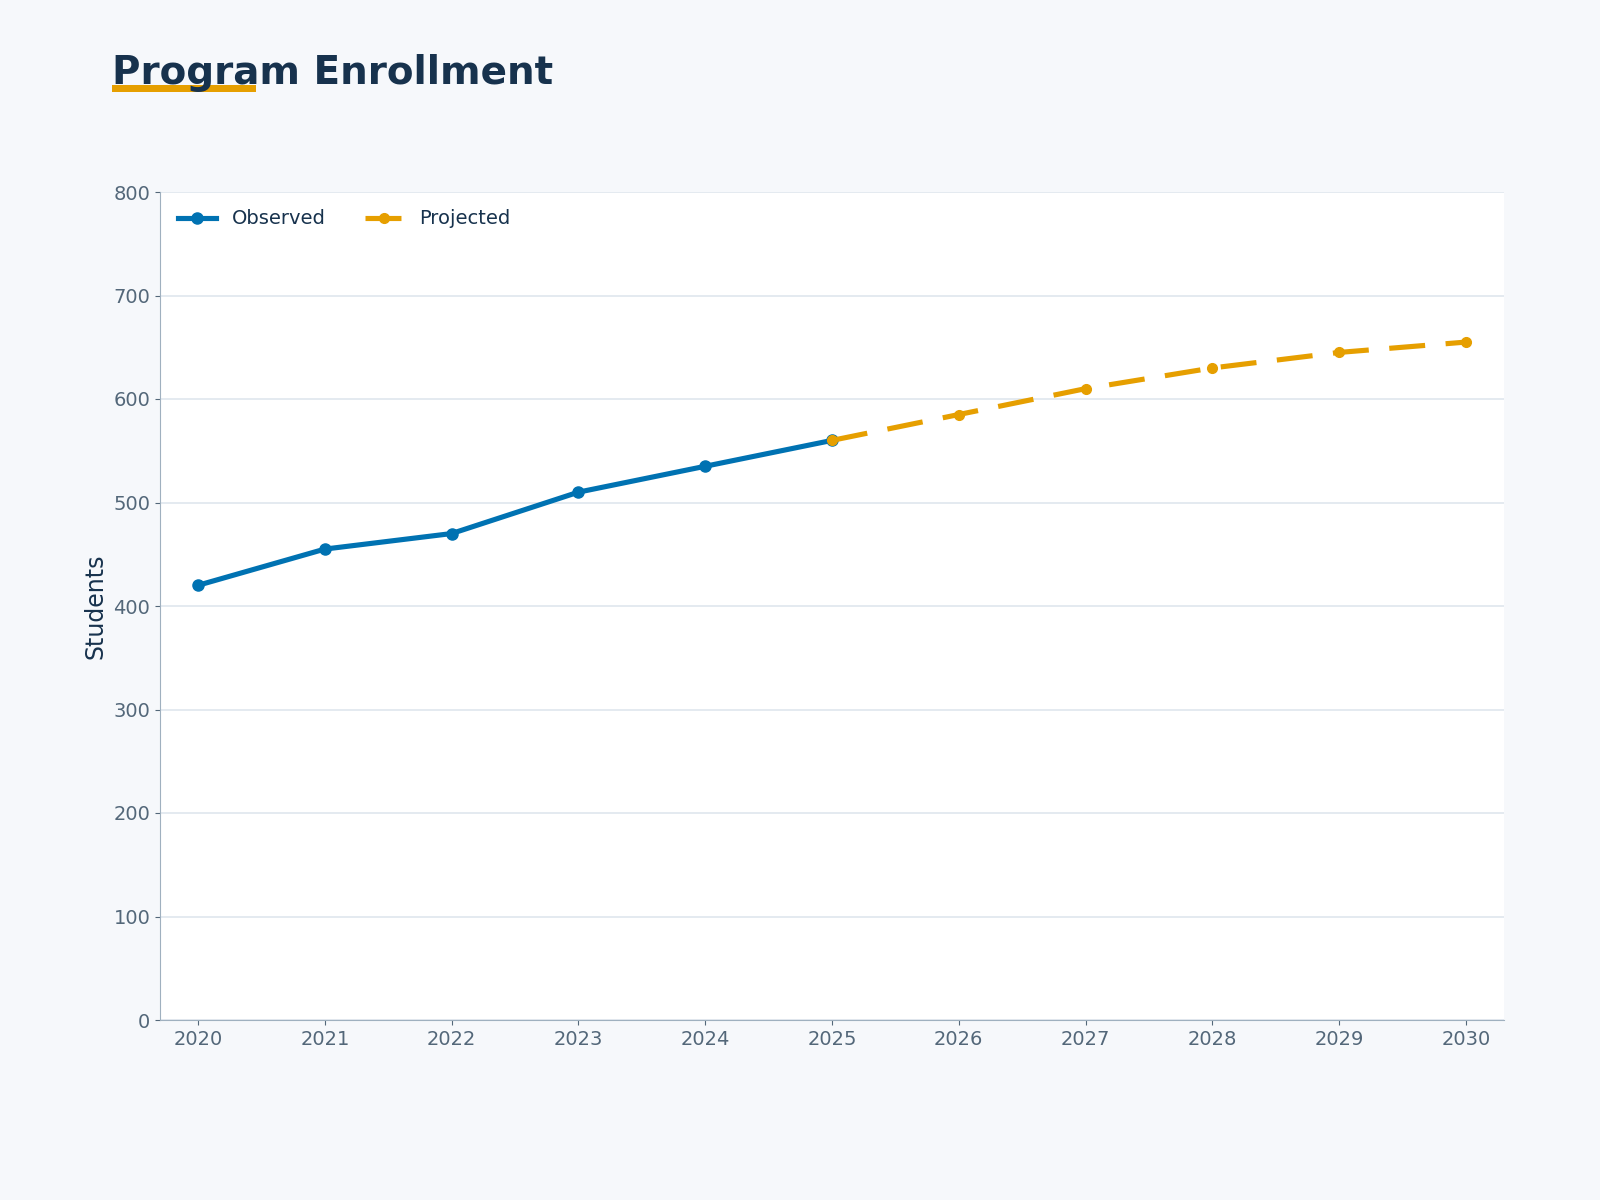
A chart uses a solid line through 2025 and a dashed line from 2026 to 2030. What distinction should a speaker make?
A
All values are measured because they appear on one line.
B
Dashed values are necessarily lower than solid values.
C
Values through 2025 are observed, while 2026-2030 values are model projections.
D
The projection is guaranteed because the dashed line is smooth.
Submit Answer