6.51 Data Sensemaking and Visual Literacy
0%
Skill Level🔴 Hard
00:00
Progress to Next Level25% to Medium
EasyMediumHardMastery100%
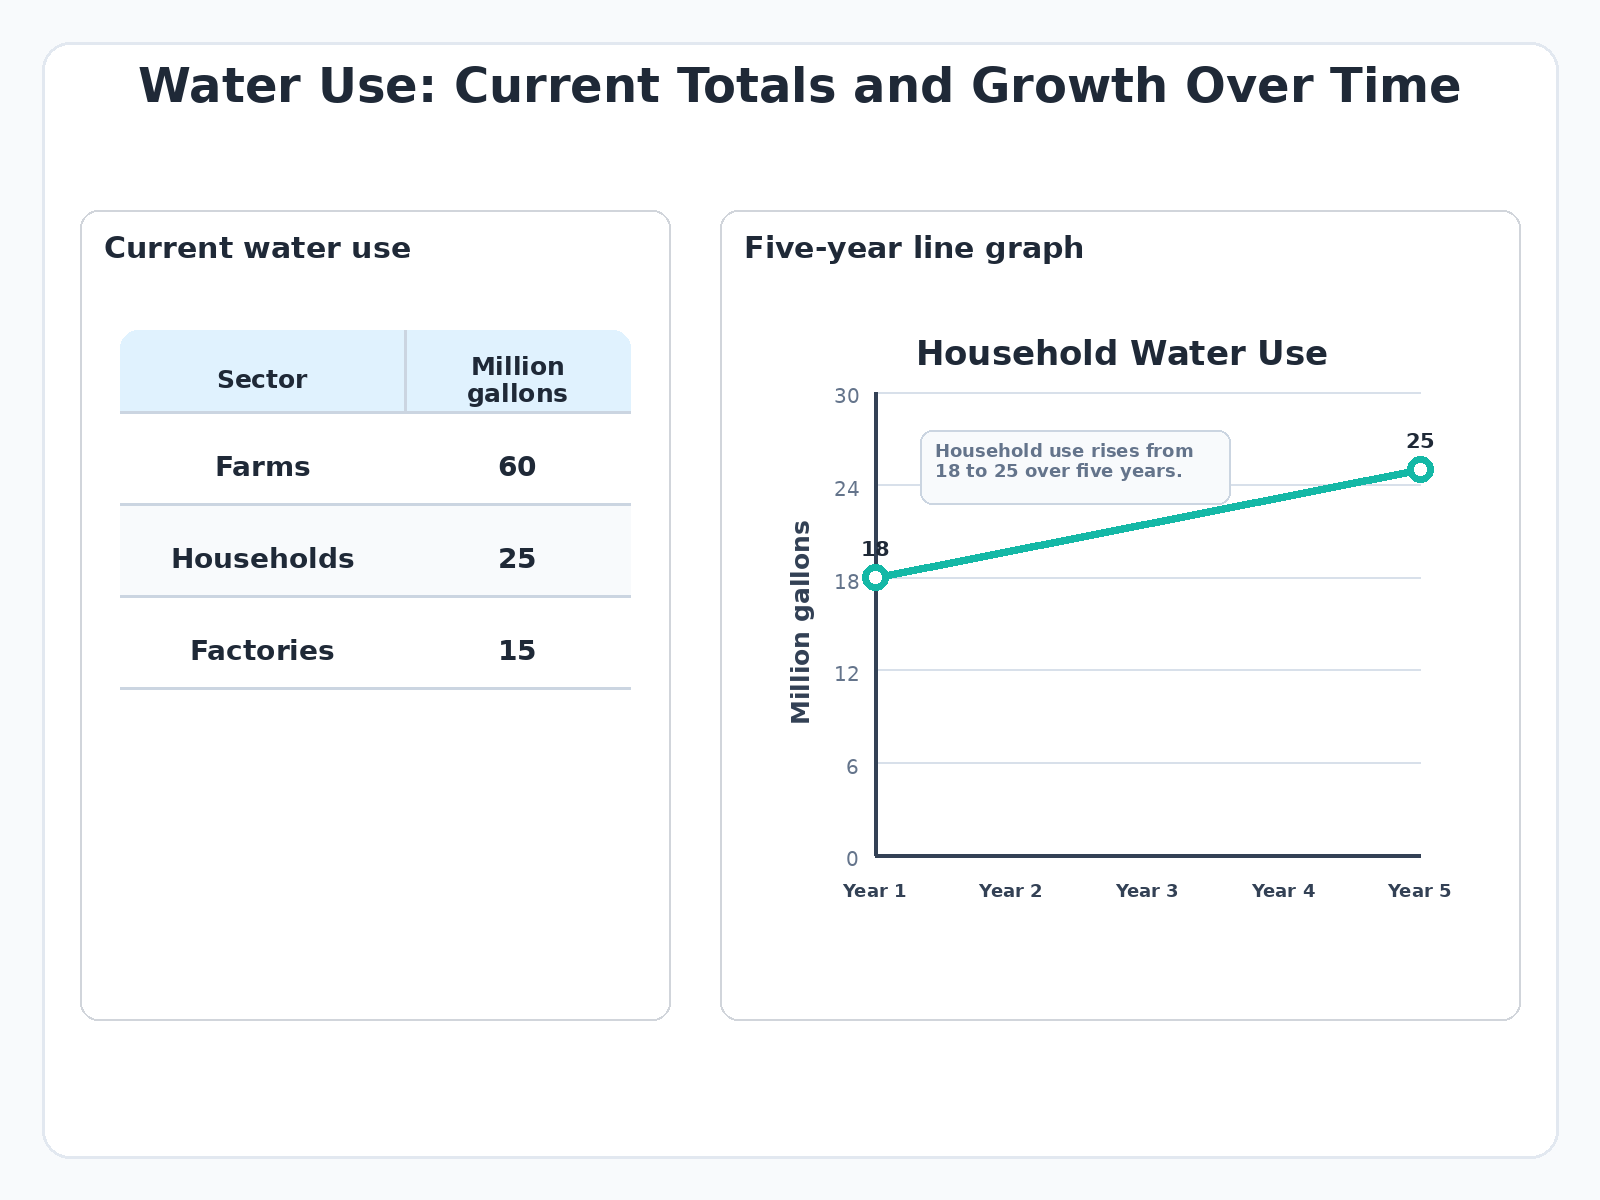
Use the planned table and line graph about water use. The table shows farms use the most total water. The line graph shows household water use rose fastest over five years. Which summary is most accurate?