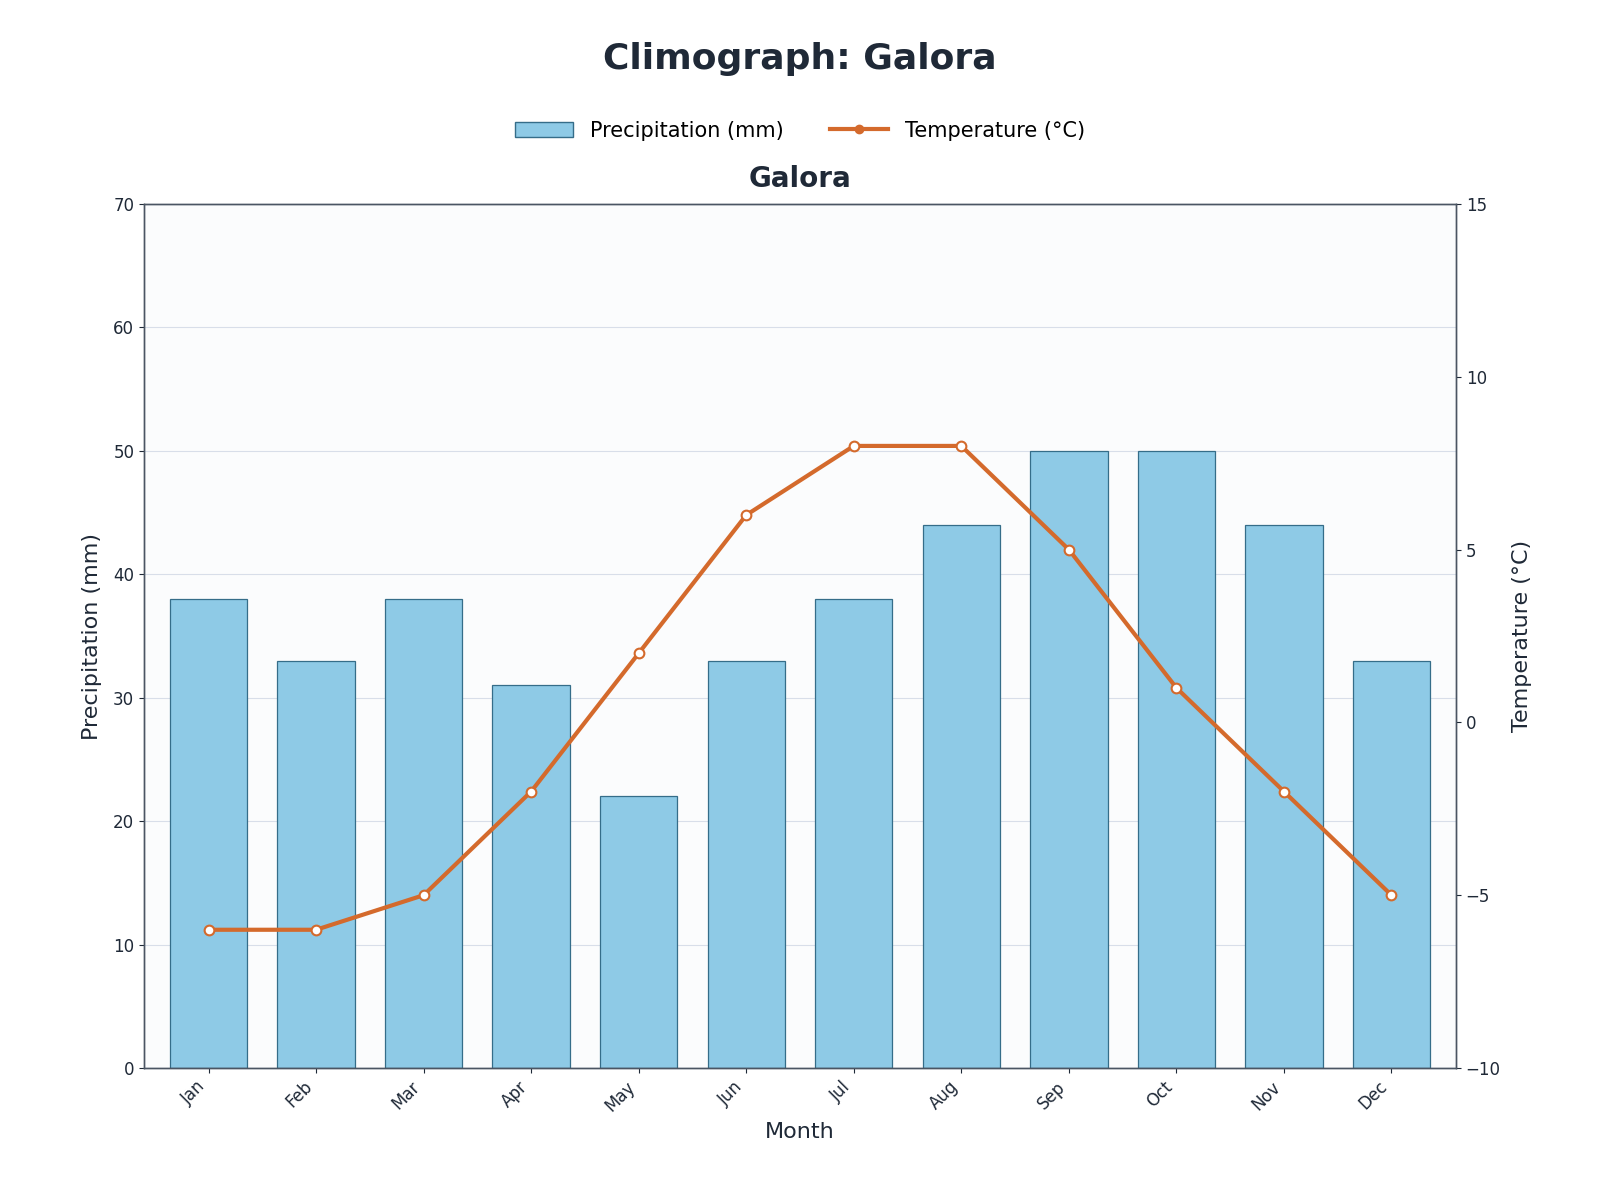
7.21 Read and Compare Climate Graphs
0%
Skill Level🔴 Hard
00:00
Progress to Next Level25% to Medium
EasyMediumHardMastery100%
The climograph for Galora shows cold temperatures for much of the year, a short cool summer, and a smaller annual temperature range than many inland cold places. Which inference is best supported?