8.113 Visual and Data Literacy: Graphs, Charts, and Maps
0%
Skill Level🔴 Hard
00:00
Progress to Next Level25% to Medium
EasyMediumHardMastery100%
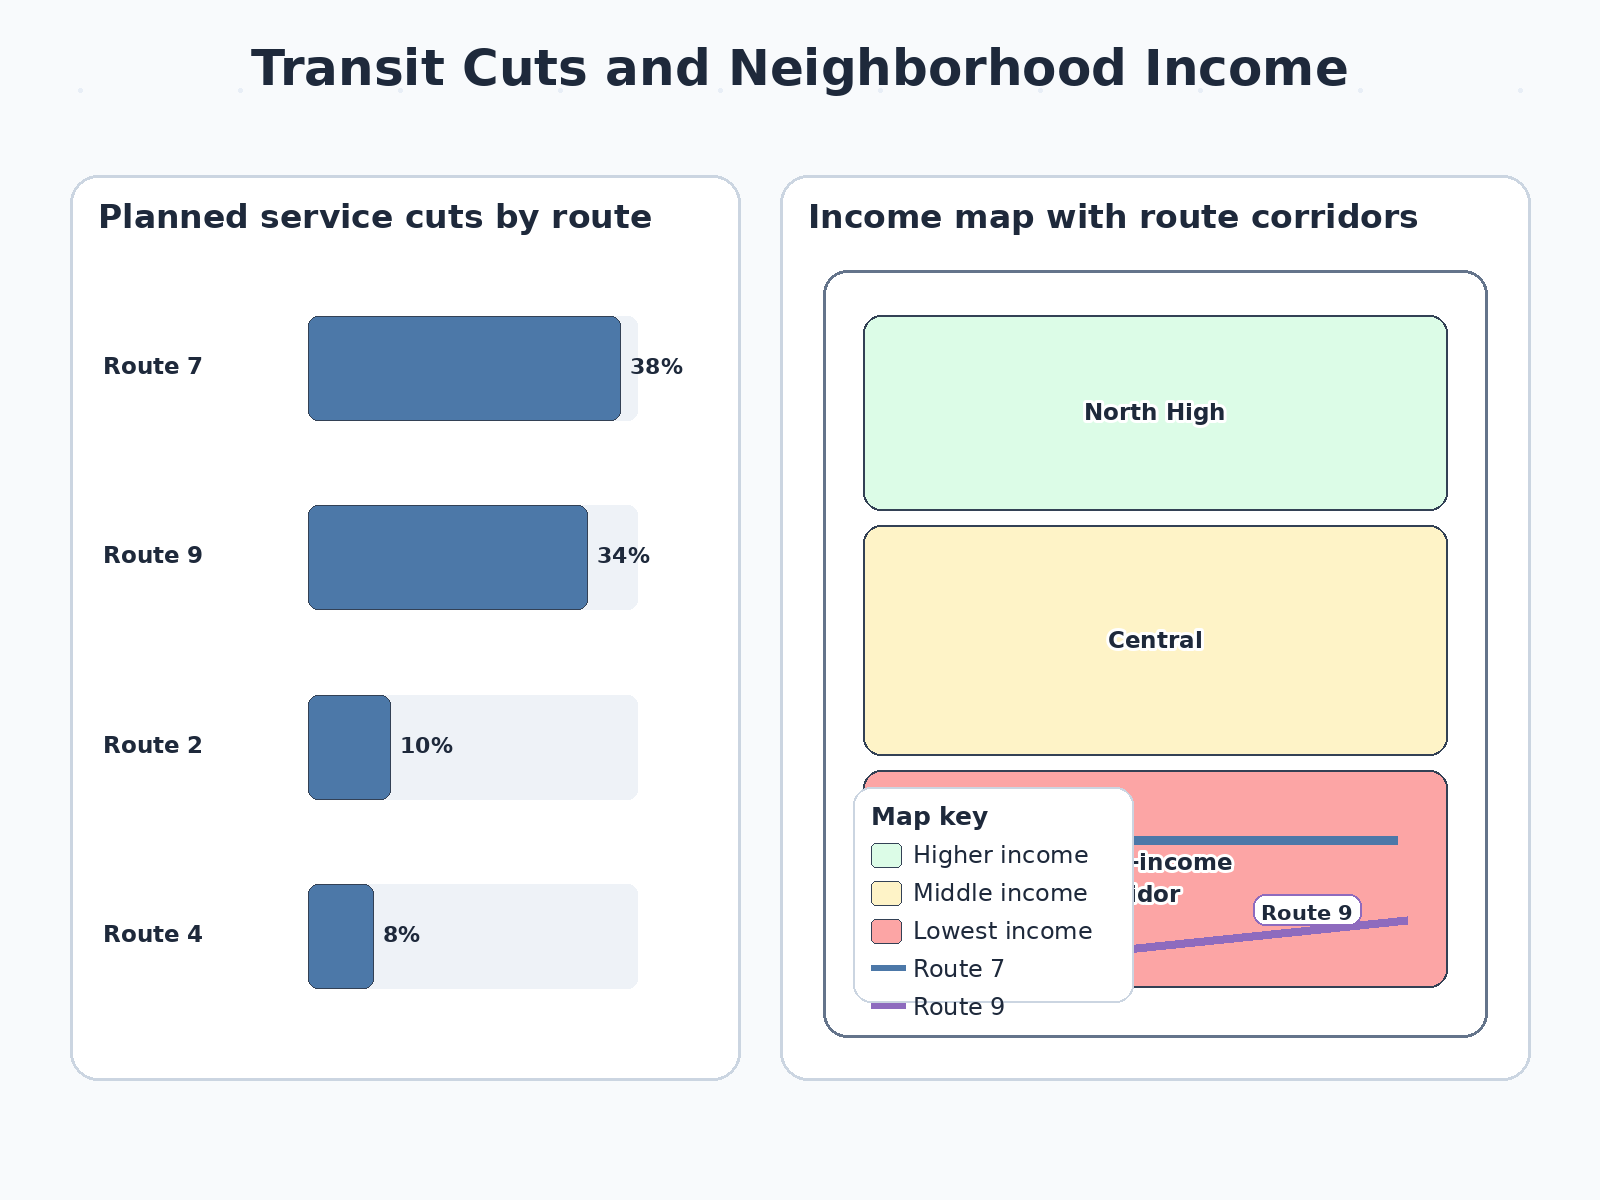
A transit chart shows most service cuts are planned on Route 7 and Route 9. An income map shows both routes serve the lowest-income neighborhoods. Which recommendation is most equity-focused?