9.43 Integrating Data, Charts, and Maps into Explanations
0%
Skill Level🔴 Hard
00:00
Progress to Next Level25% to Medium
EasyMediumHardMastery100%
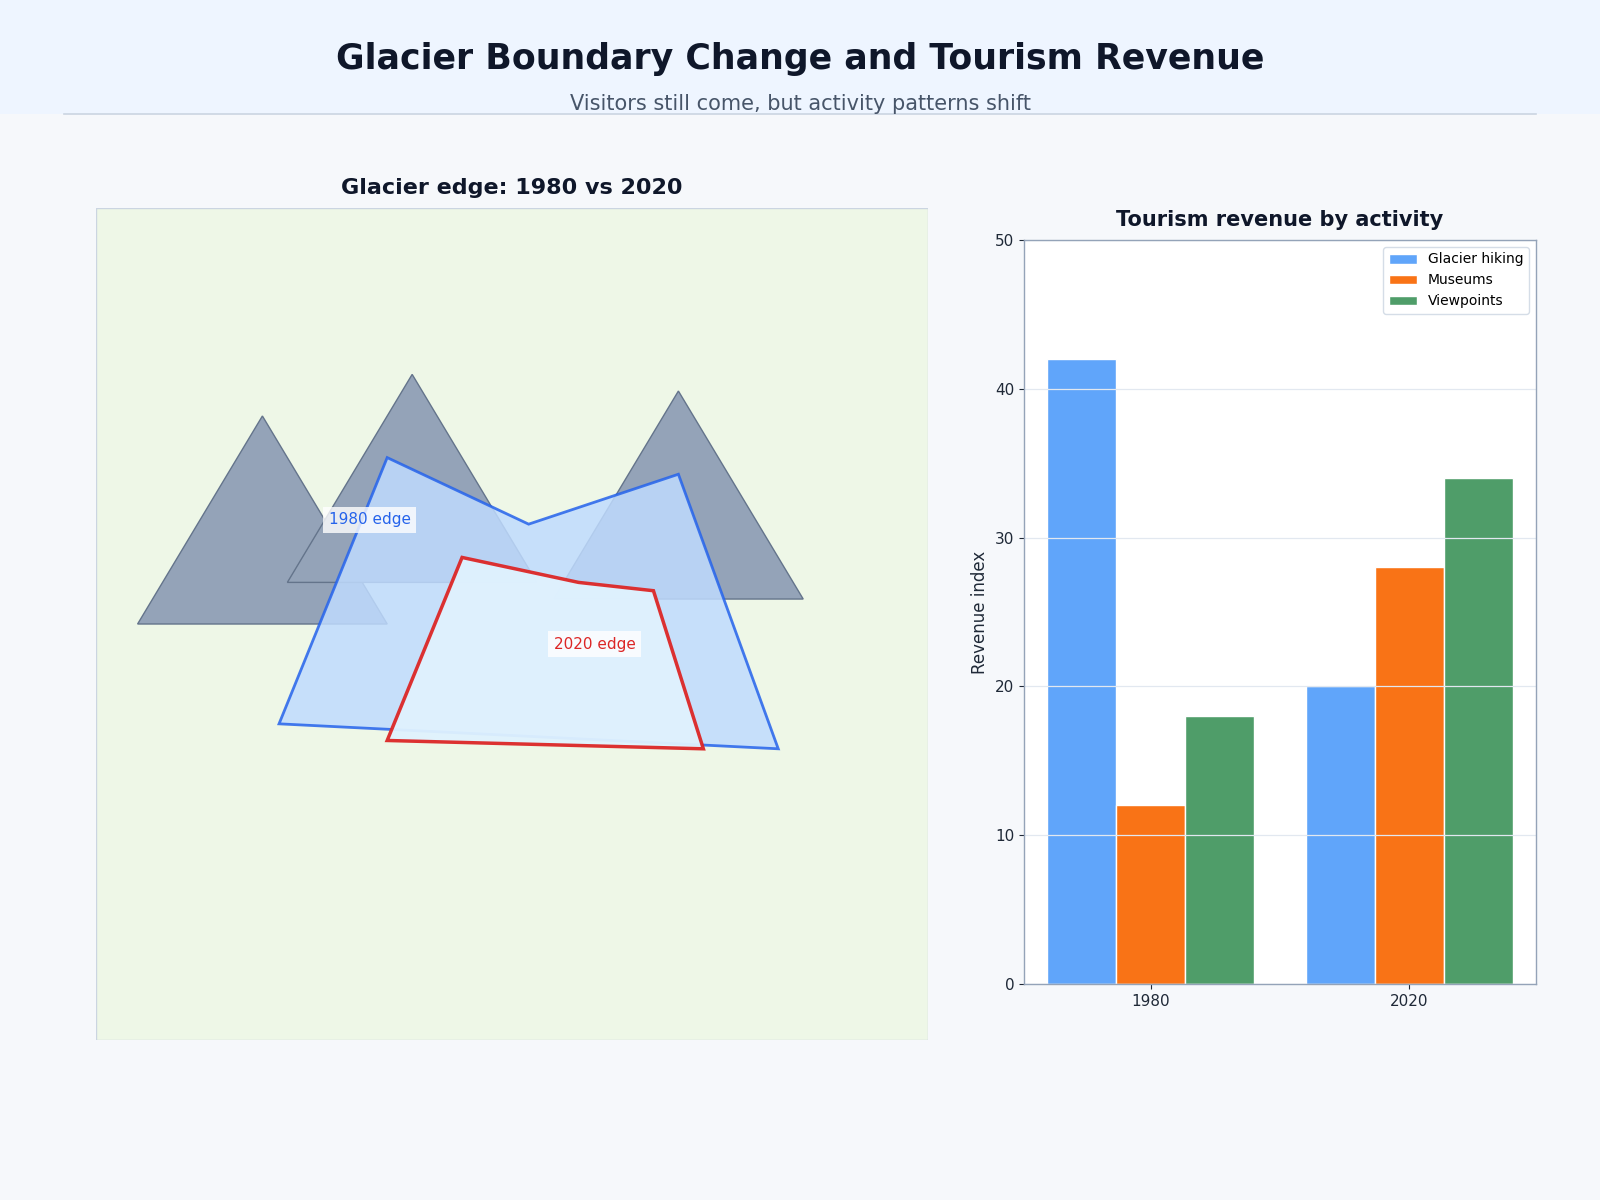
Use the map comparing a glacier's edge in 1980 and 2020, the tourism chart showing visitor revenue staying high but shifting from glacier hiking toward museums and viewpoints, and the ranger's statement, 'Visitors still come, but the experience has changed.' Which explanation best integrates the sources?