APB.030 Add a Trend Line
0%
Skill Level🔴 Hard
00:00
Progress to Next Level25% to Medium
EasyMediumHardMastery100%
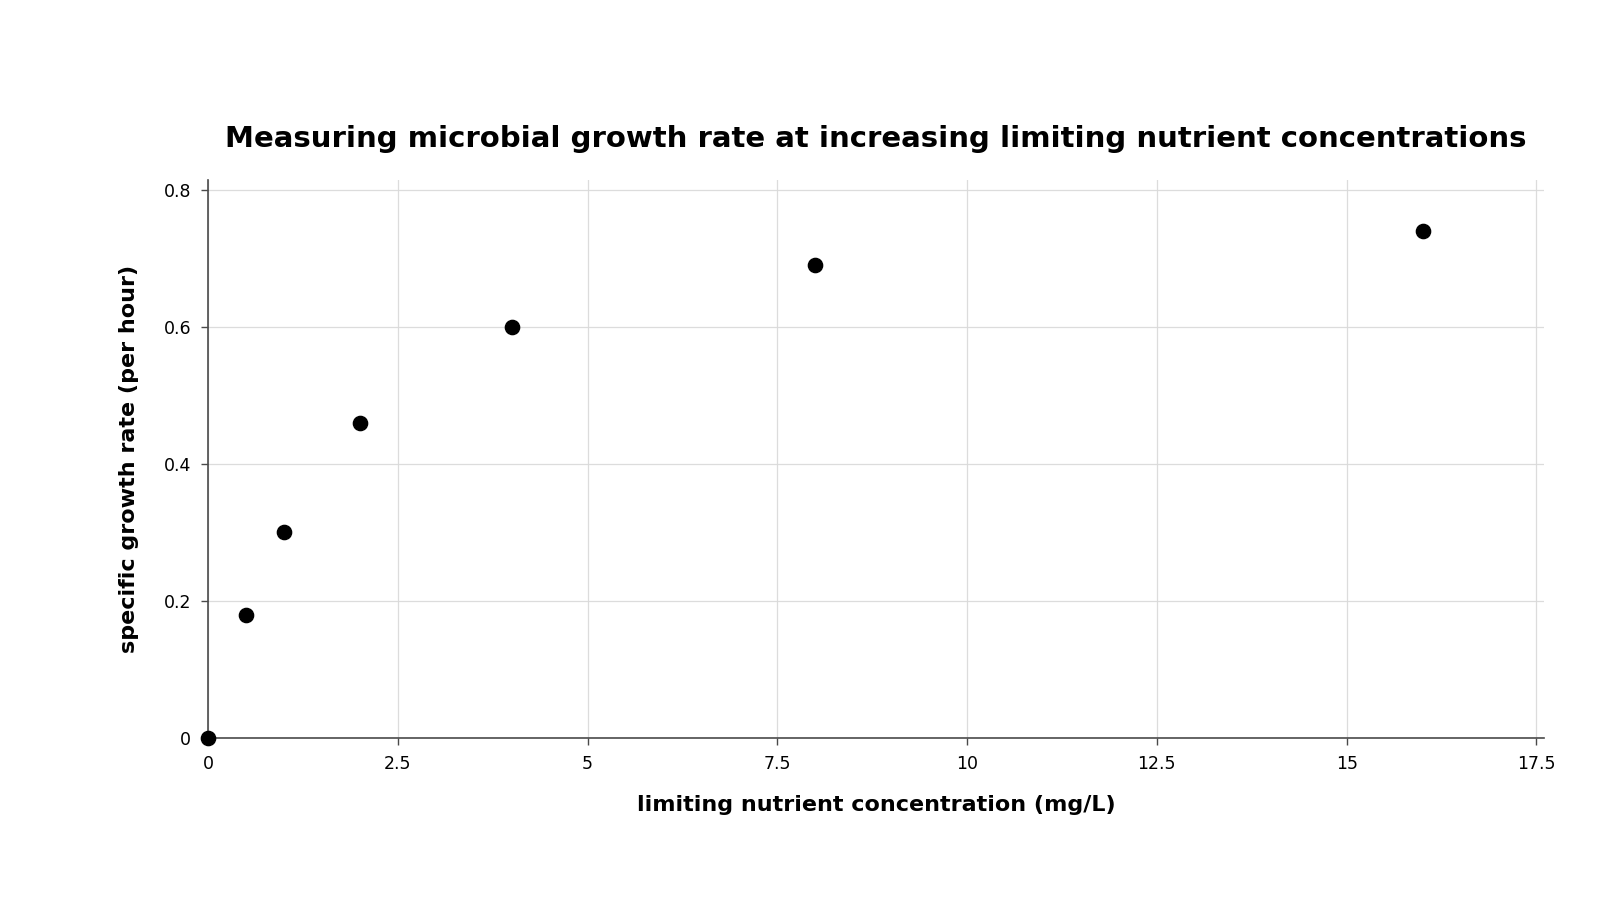
Researchers graphed measuring microbial growth rate at increasing limiting nutrient concentrations and obtained these points: (0, 0); (0.5, 0.18); (1, 0.3); (2, 0.46); (4, 0.6); (8, 0.69); (16, 0.74). The graph uses limiting nutrient concentration (mg/L) as x and specific growth rate (per hour) as y. Which best-fit trend should be shown?