APB.406 Allopatric Speciation
0%
Skill Level🔴 Hard
00:00
Progress to Next Level25% to Medium
EasyMediumHardMastery100%
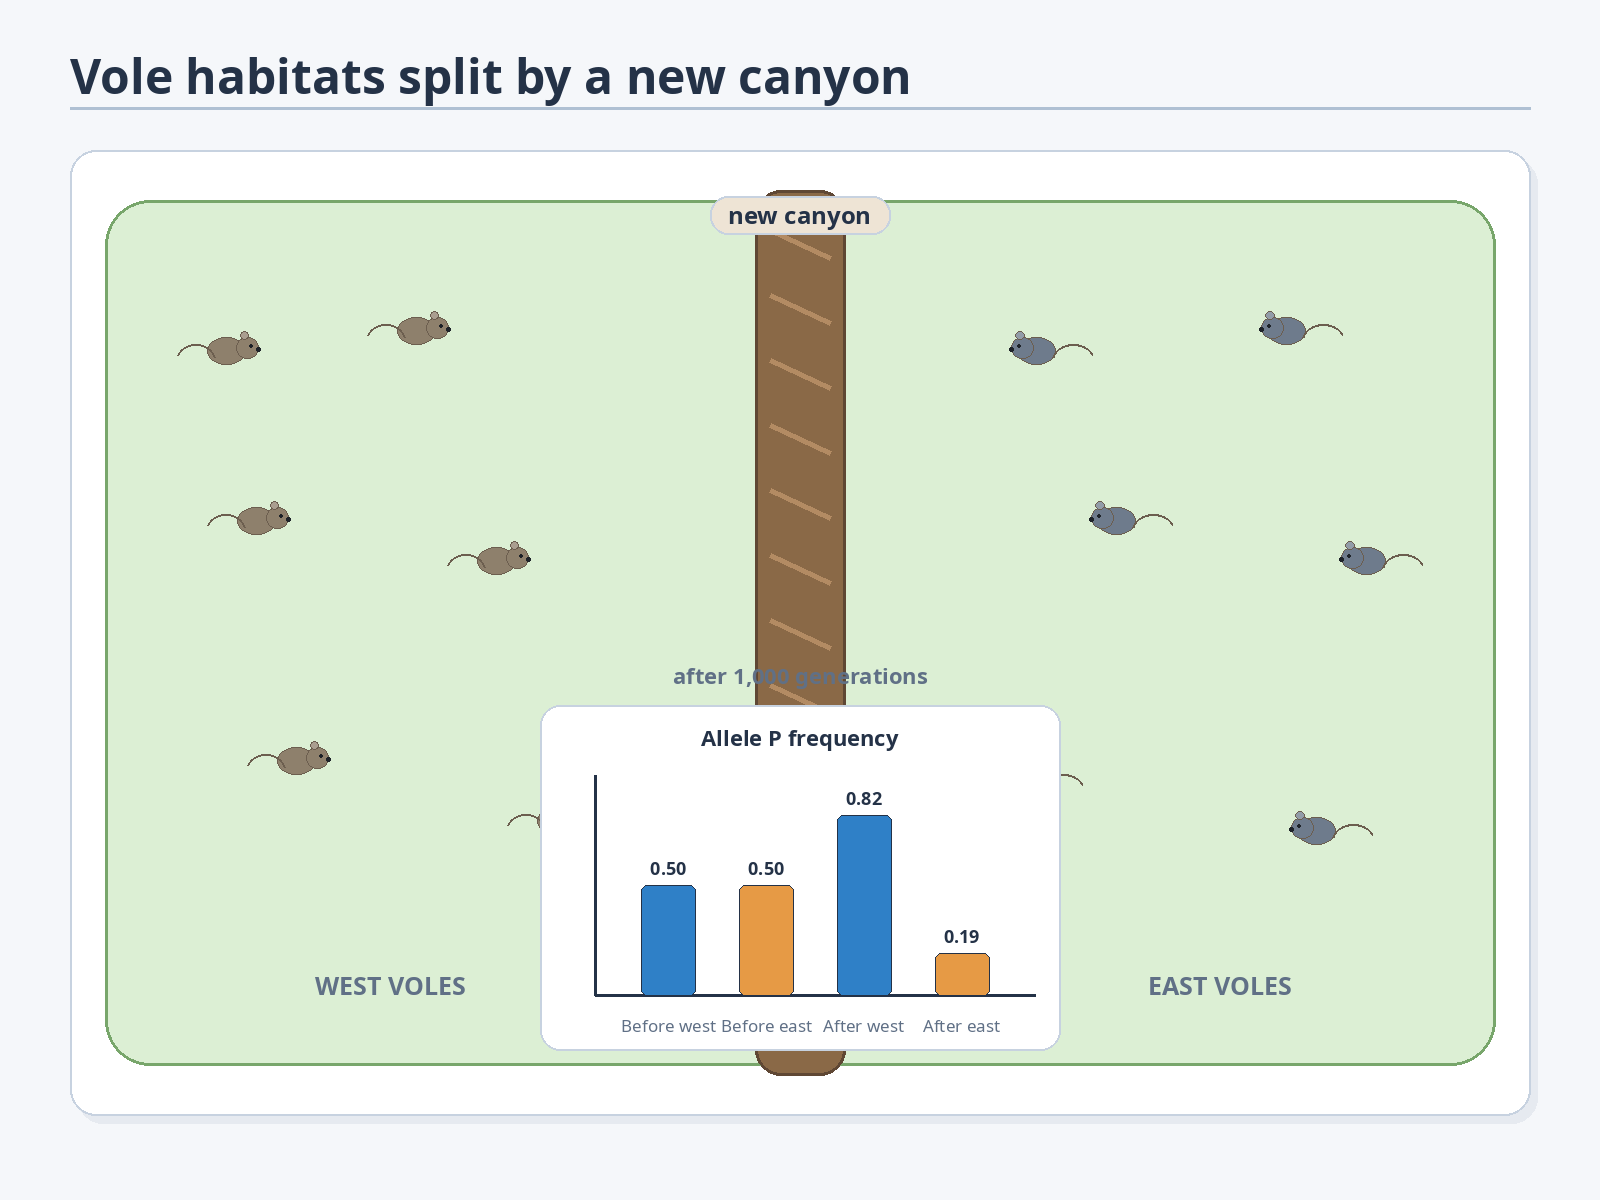
A map and inset bar chart show two vole populations separated by a new canyon. The map shows no observed movement across the canyon. The bar chart shows allele P frequency changing from 0.50 in both populations to 0.82 west and 0.19 east after 1,000 generations. What is the best interpretation?