APB.041 Compare Confidence Intervals and Error Bars
0%
Skill Level🔴 Hard
00:00
Progress to Next Level25% to Medium
EasyMediumHardMastery100%
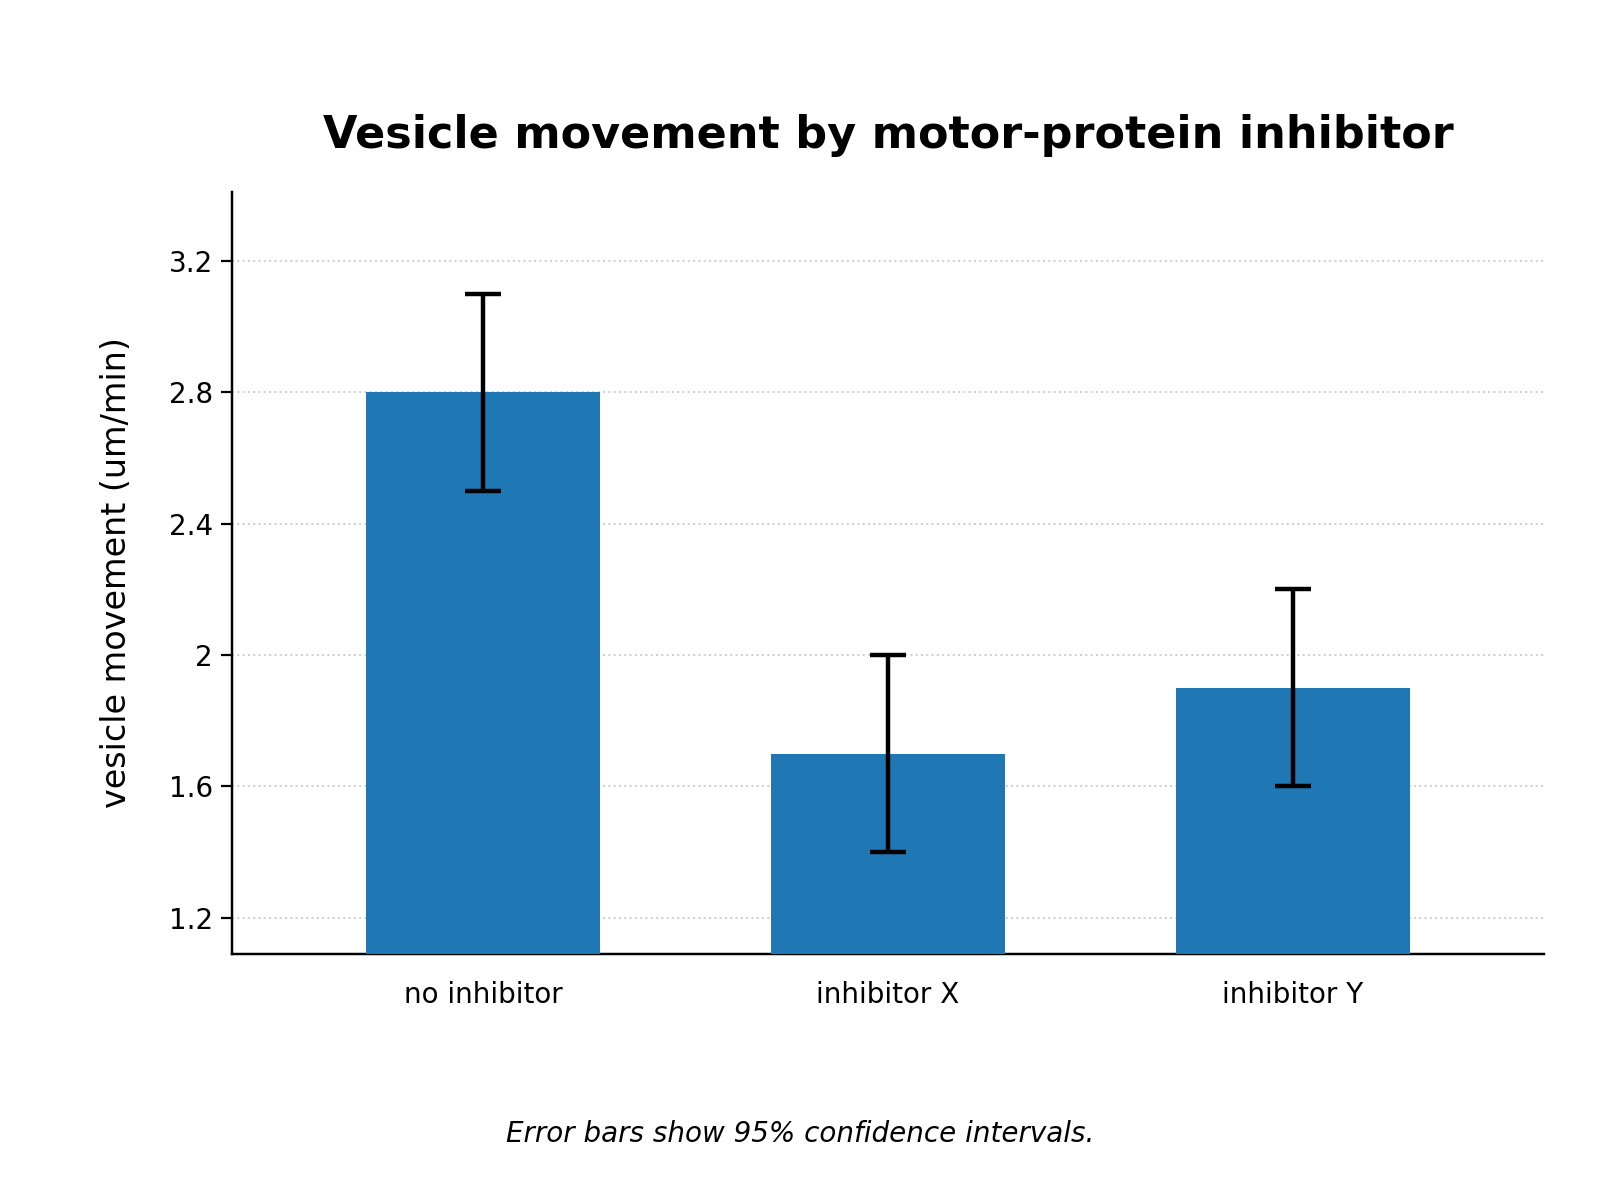
Students compare average vesicle movement in cells treated with three motor-protein inhibitors. The displayed graph uses 95% confidence interval error bars: no inhibitor, mean 2.8 um/min, CI 2.5 to 3.1; inhibitor X, mean 1.7 um/min, CI 1.4 to 2; inhibitor Y, mean 1.9 um/min, CI 1.6 to 2.2. Which conclusion is best supported by the displayed confidence intervals?