APB.283 Genotype-by-Environment Data [Mini Skill]
0%
Skill Level🔴 Hard
00:00
Progress to Next Level25% to Medium
EasyMediumHardMastery100%
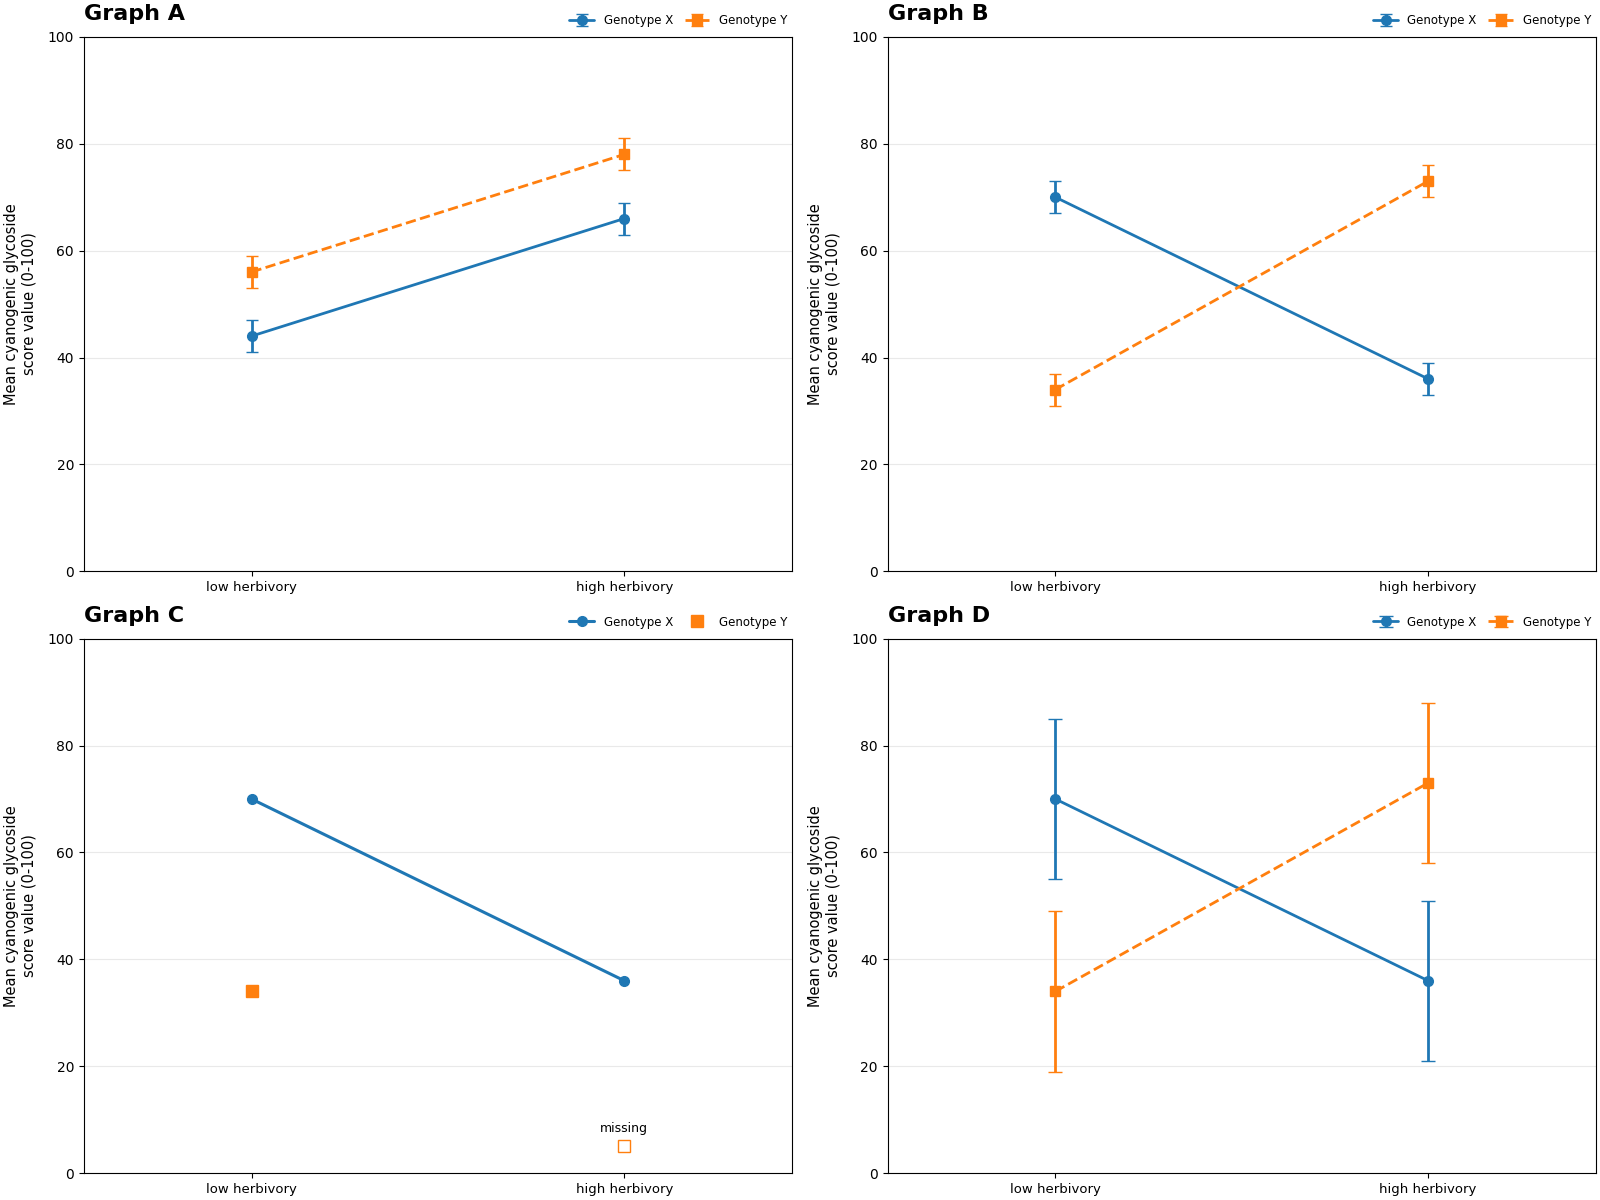
An AP Biology class evaluates graphs from a full-factorial genotype x environment experiment on cassava lines with equal sample sizes. Which graph gives the strongest support for a genotype-by-environment interaction in cyanogenic glycoside score?