APB.026 Label Axes, Units, and Legends
0%
Skill Level🔴 Hard
00:00
Progress to Next Level25% to Medium
EasyMediumHardMastery100%
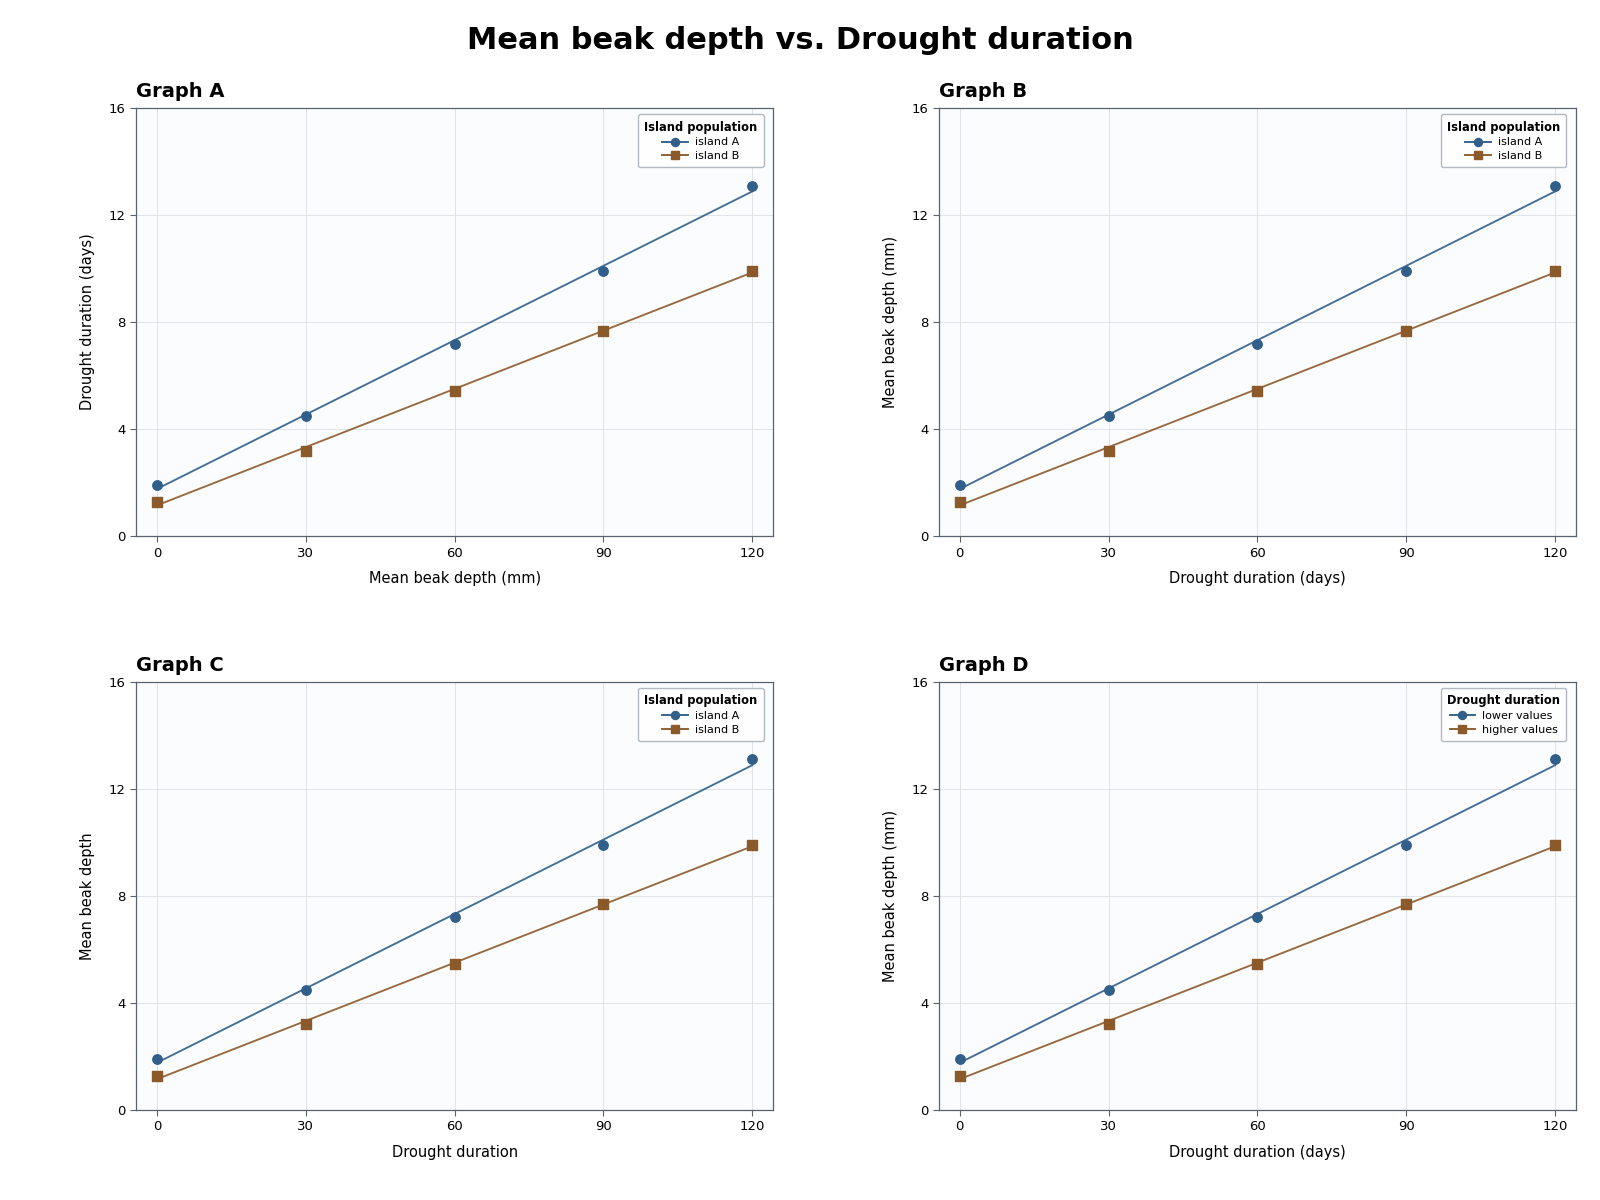
A research-style AP Biology figure is being made from this experiment: An evolution field study compares mean beak depth after different drought durations. Which graph correctly distinguishes the manipulated variable, measured response, units, and plotted-group legend?