APB.028 Plot Data Accurately
0%
Skill Level🔴 Hard
00:00
Progress to Next Level25% to Medium
EasyMediumHardMastery100%
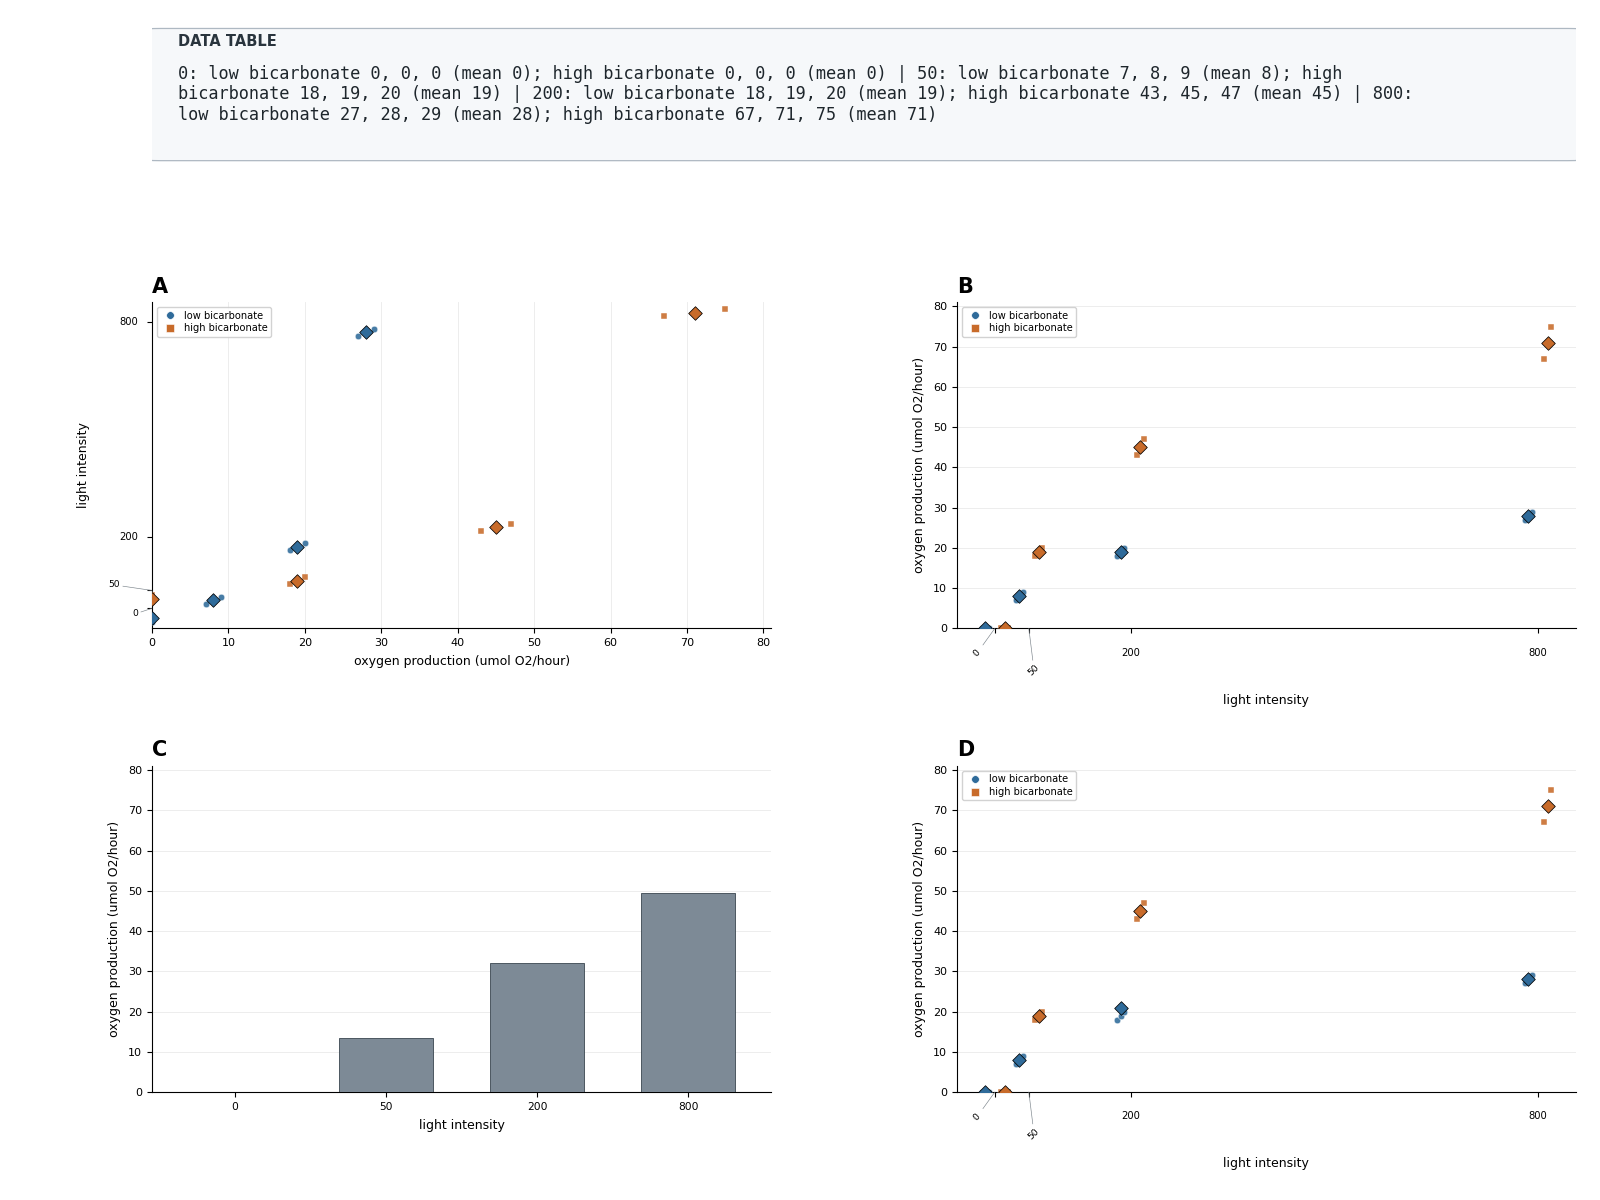
An AP Biology investigation measured oxygen production across light intensities under low and high bicarbonate. Replicate measurements and means are shown for graphing. Data table (oxygen production in umol O2/hour): 0: low bicarbonate 0, 0, 0 (mean 0); high bicarbonate 0, 0, 0 (mean 0) | 50: low bicarbonate 7, 8, 9 (mean 8); high bicarbonate 18, 19, 20 (mean 19) | 200: low bicarbonate 18, 19, 20 (mean 19); high bicarbonate 43, 45, 47 (mean 45) | 800: low bicarbonate 27, 28, 29 (mean 28); high bicarbonate 67, 71, 75 (mean 71). Which graph correctly plots all data points, categories, means, and treatment groups?