APB.450 Population-Growth Data [Mini Skill]
0%
Skill Level🔴 Hard
00:00
Progress to Next Level25% to Medium
EasyMediumHardMastery100%
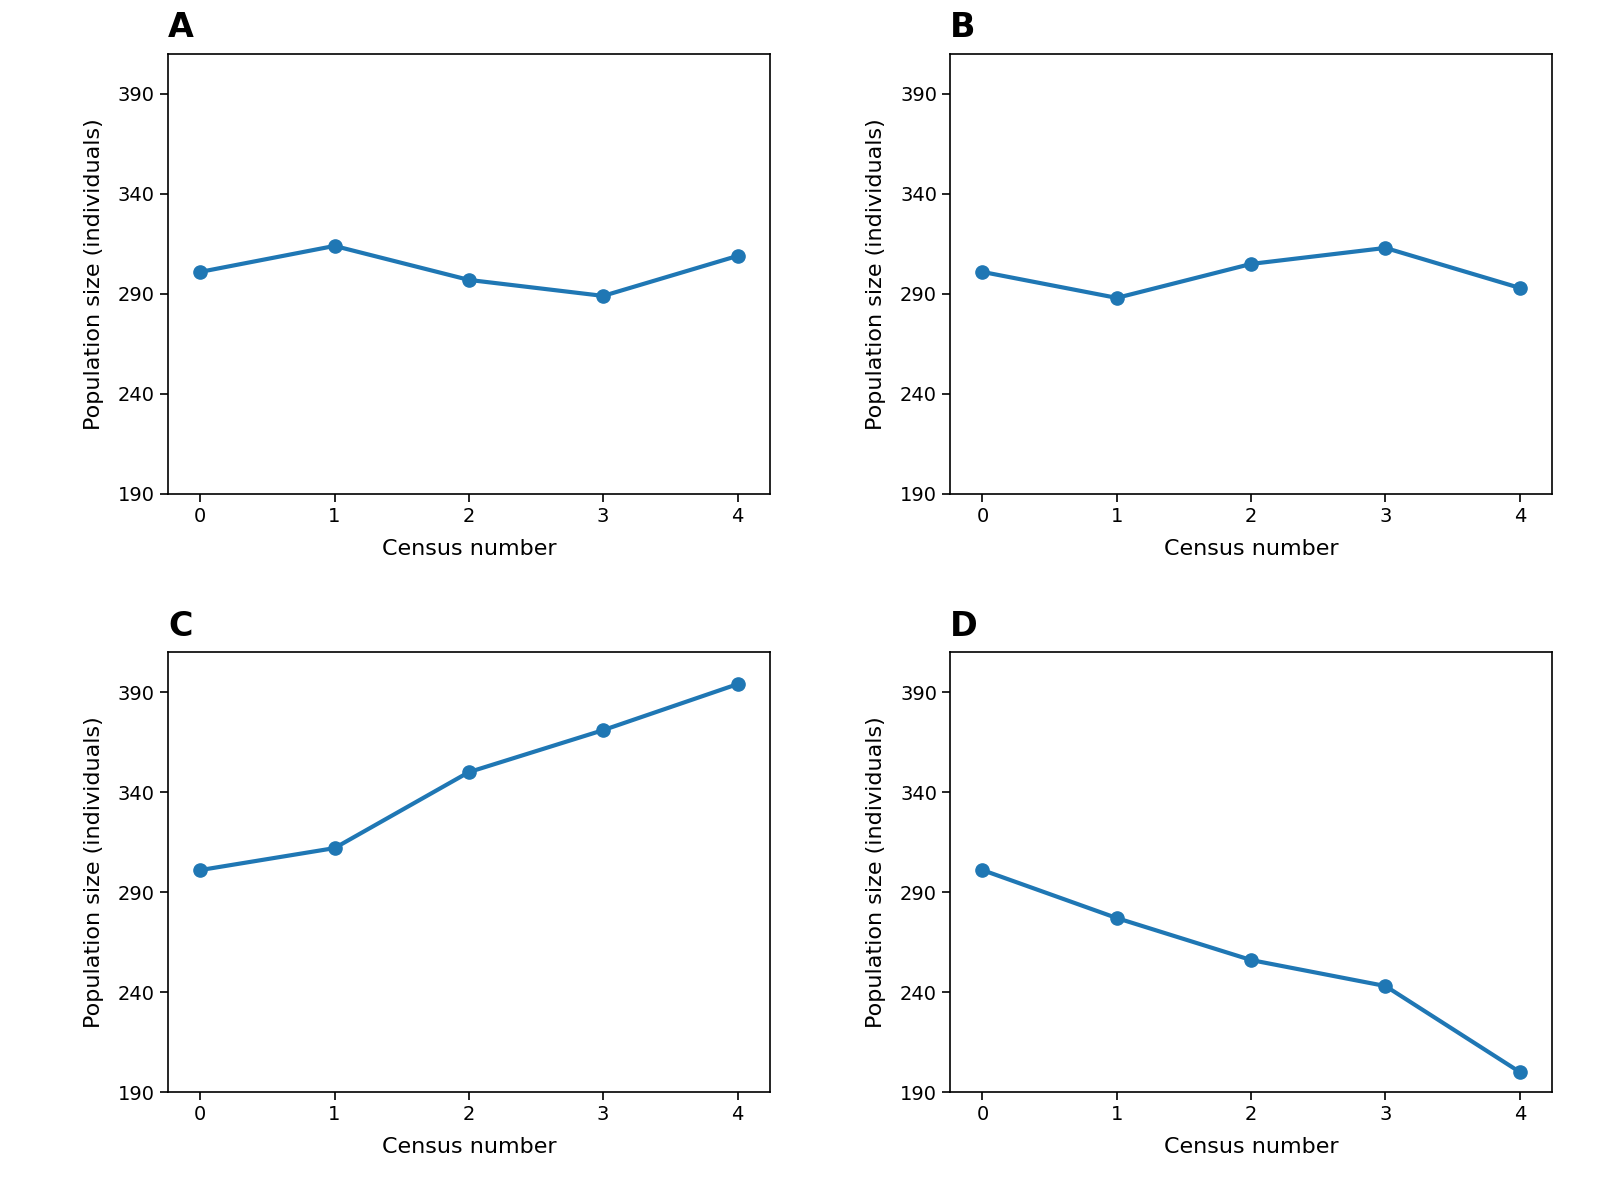
An AP Biology class follows a population of orchid seedlings in a conservation nursery. The starting population at census 0 is 301. Births and deaths for four intervals are reported as follows: interval 0-1: 11 births and 24 deaths; interval 1-2: 38 births and 21 deaths; interval 2-3: 21 births and 13 deaths; interval 3-4: 23 births and 43 deaths. Assuming a closed population, which graph best represents the predicted total population size across censuses 0 through 4?