APB.029 Represent Error Bars
0%
Skill Level🔴 Hard
00:00
Progress to Next Level25% to Medium
EasyMediumHardMastery100%
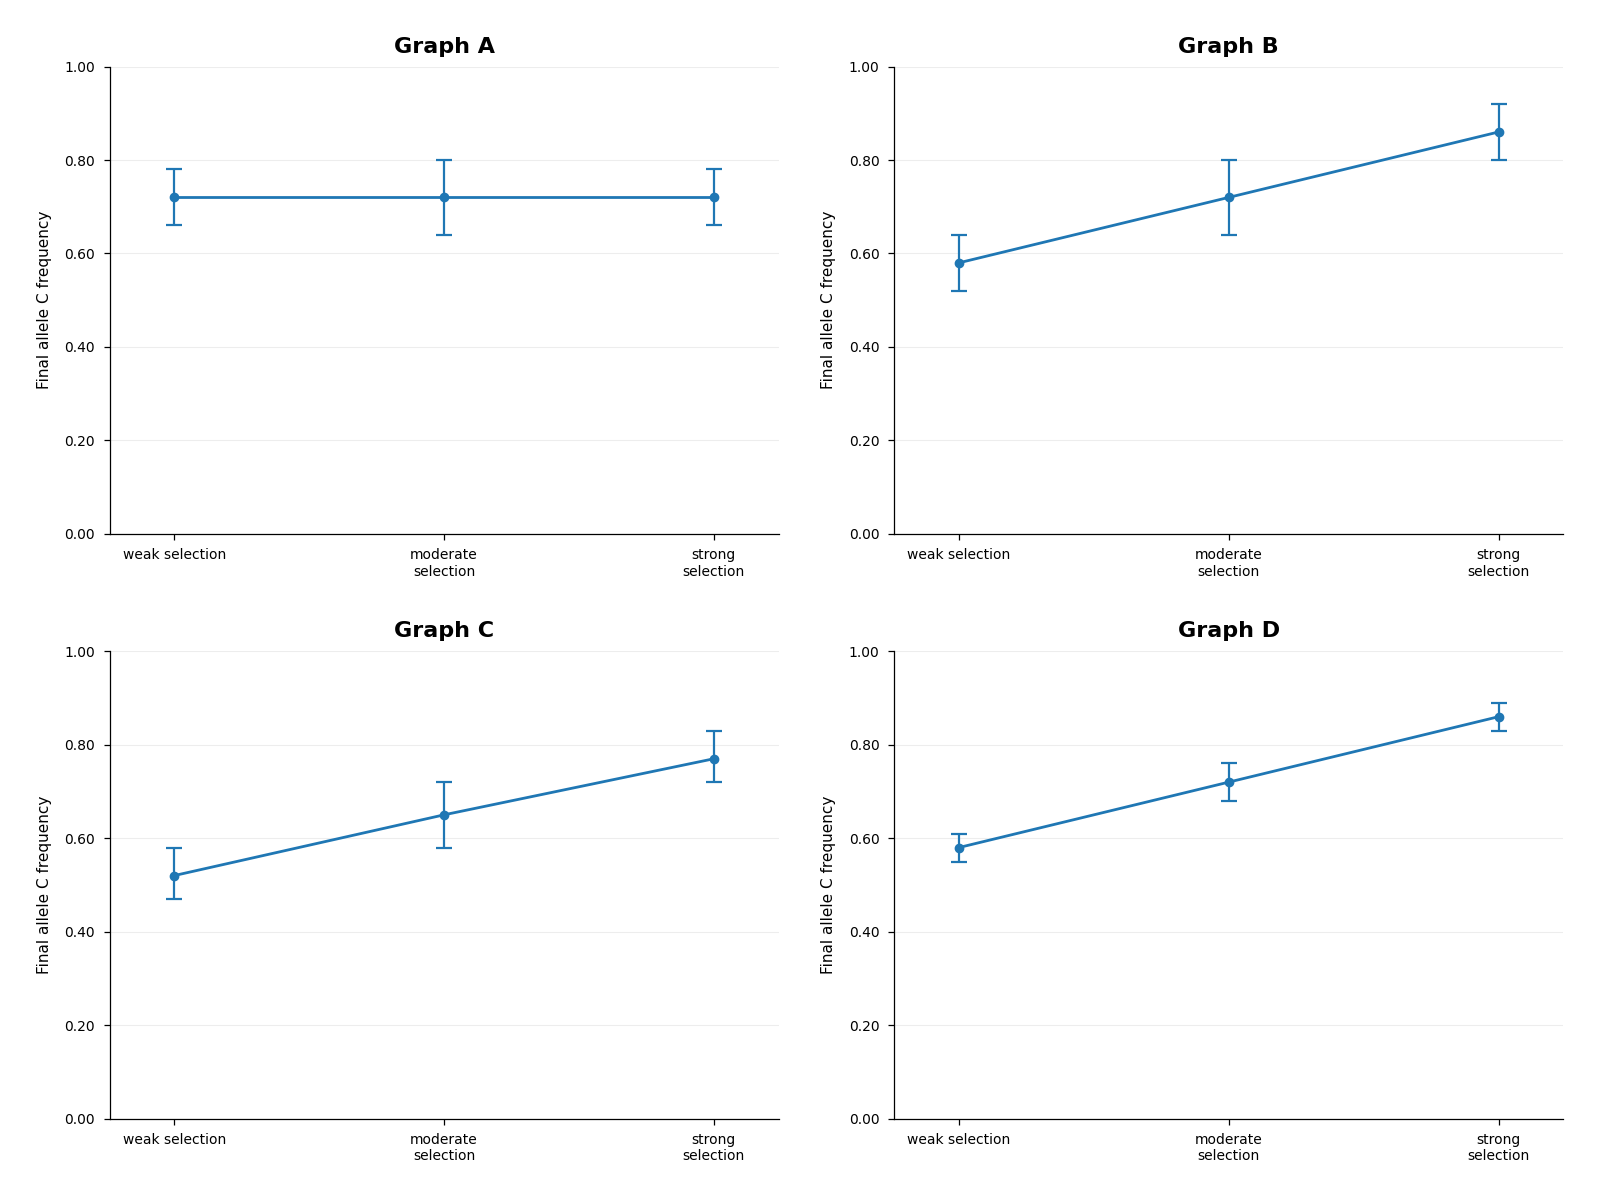
A model of natural selection tracked allele frequency after three selection strengths and required error bars of ±2 SEM. The table lists the mean and SEM for each condition, and the figure should display error bars equal to ±2 SEM: weak selection: mean 0.58, SEM 0.03; moderate selection: mean 0.72, SEM 0.04; strong selection: mean 0.86, SEM 0.03. The accompanying four-panel figure shows possible line graphs. Which graph correctly displays the reported variability or uncertainty using error bars?