AP.144 Charts, Graphs, and Tables as Evidence
0%
Skill Level🔴 Hard
00:00
Progress to Next Level25% to Medium
EasyMediumHardMastery100%
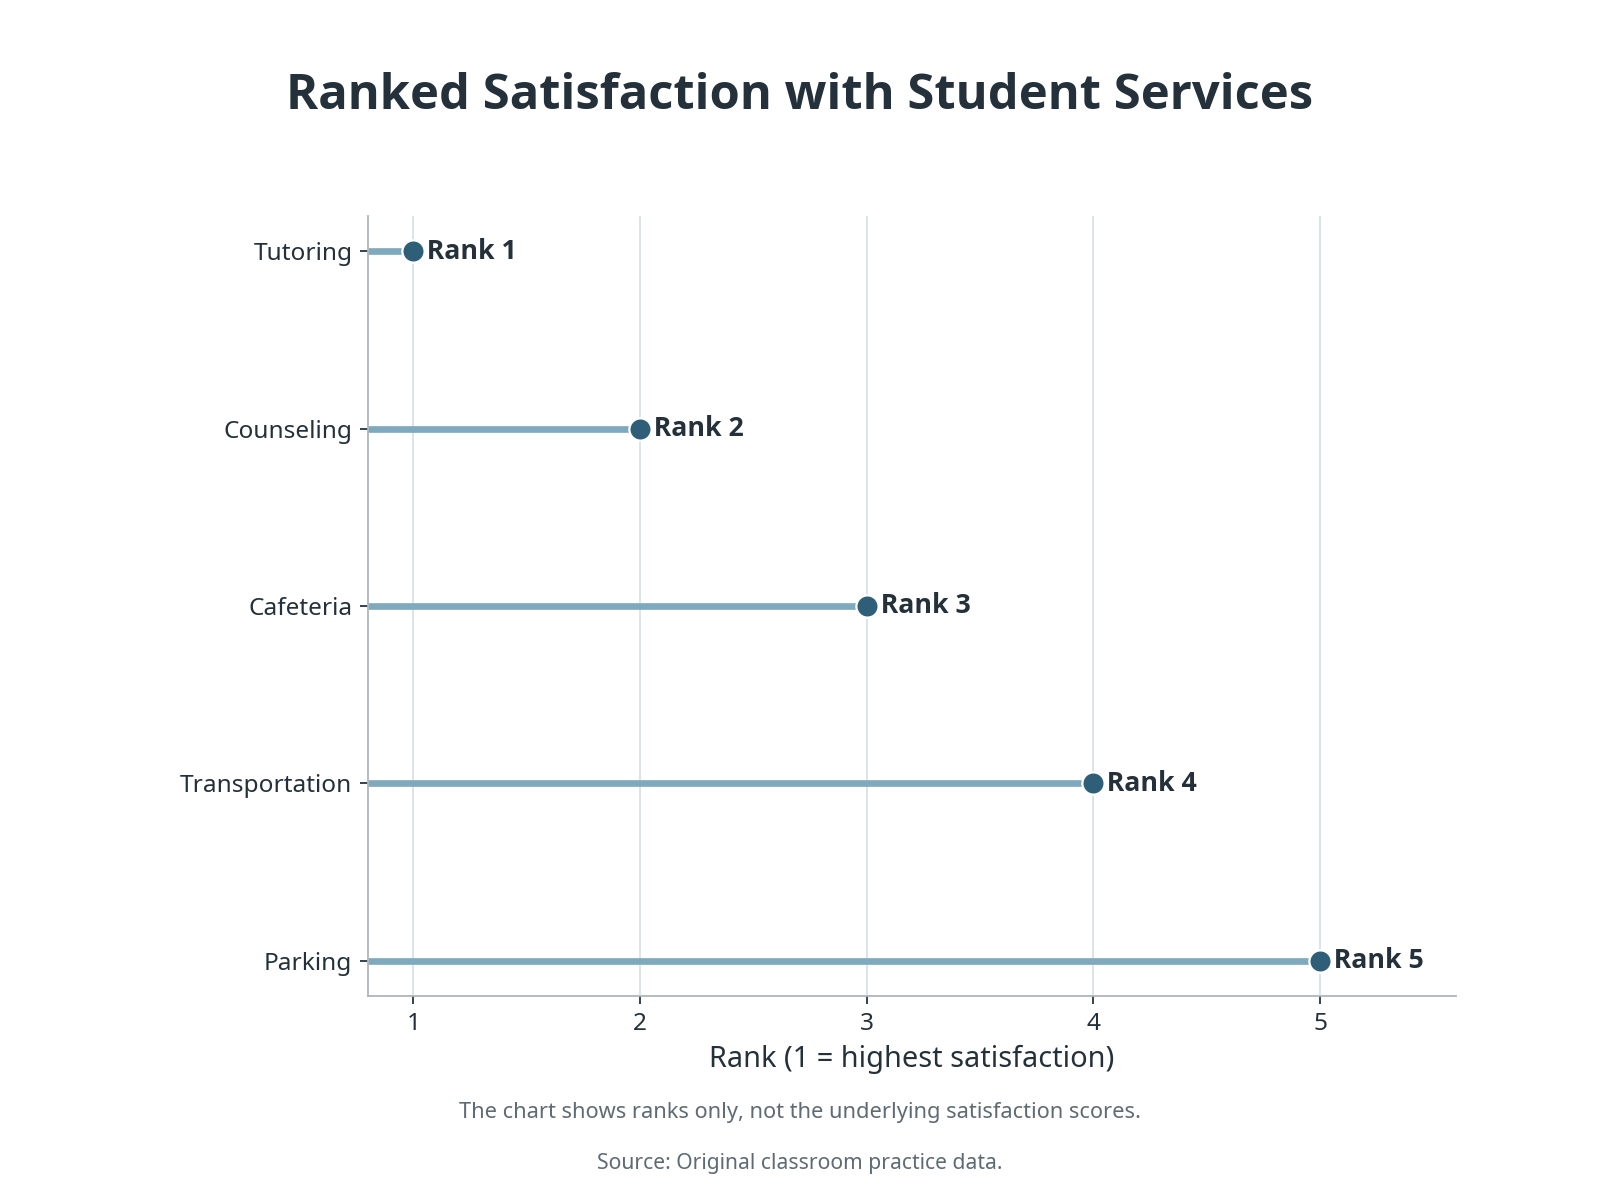
A ranking chart appears in an infographic about school services. Quantitative display: A lollipop chart ranks five services from 1 to 5 based on satisfaction score: tutoring rank 1, counseling rank 2, cafeteria rank 3, transportation rank 4, parking rank 5. The chart shows ranks only, not actual scores. Which option best reflects what the quantitative evidence can support?