AP.143 Infographics
0%
Skill Level🔴 Hard
00:00
Progress to Next Level25% to Medium
EasyMediumHardMastery100%
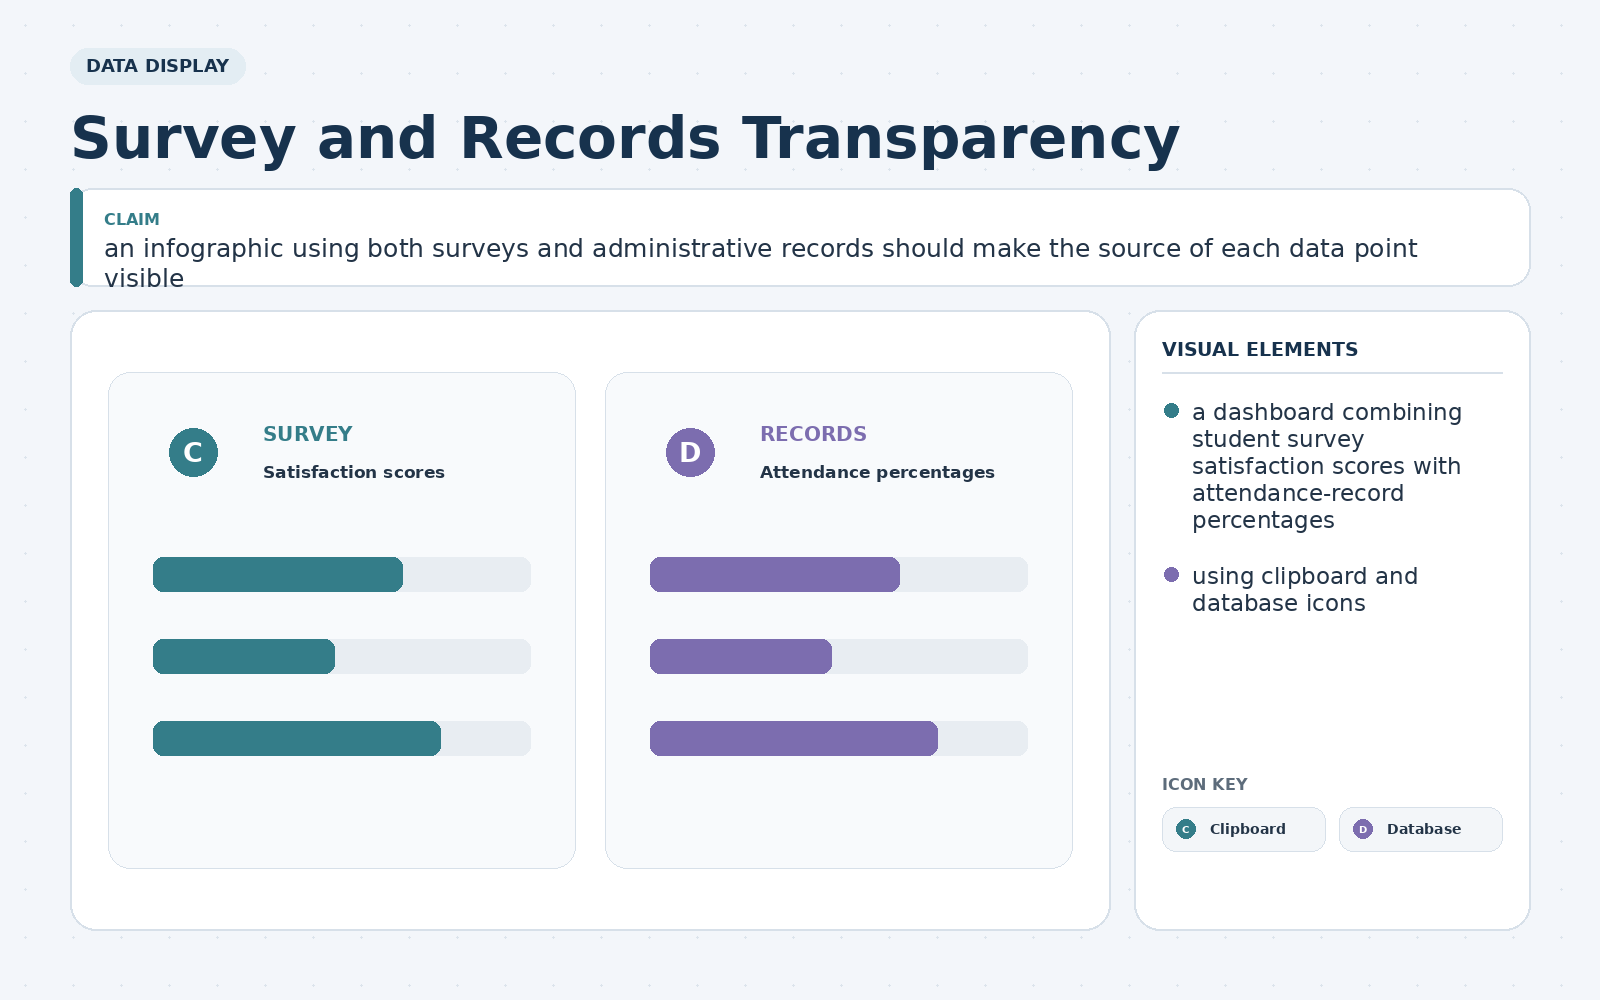
A community newsletter will publish an infographic titled "Survey and Records Transparency." It needs to argue that an infographic using both surveys and administrative records should make the source of each data point visible. The proposed visual contains a dashboard combining student survey satisfaction scores with attendance-record percentages, using clipboard and database icons. Which change would most effectively use hierarchy and explanation?