AP.054 Describe Trends and Relationships
0%
Skill Level🔴 Hard
00:00
Progress to Next Level25% to Medium
EasyMediumHardMastery100%
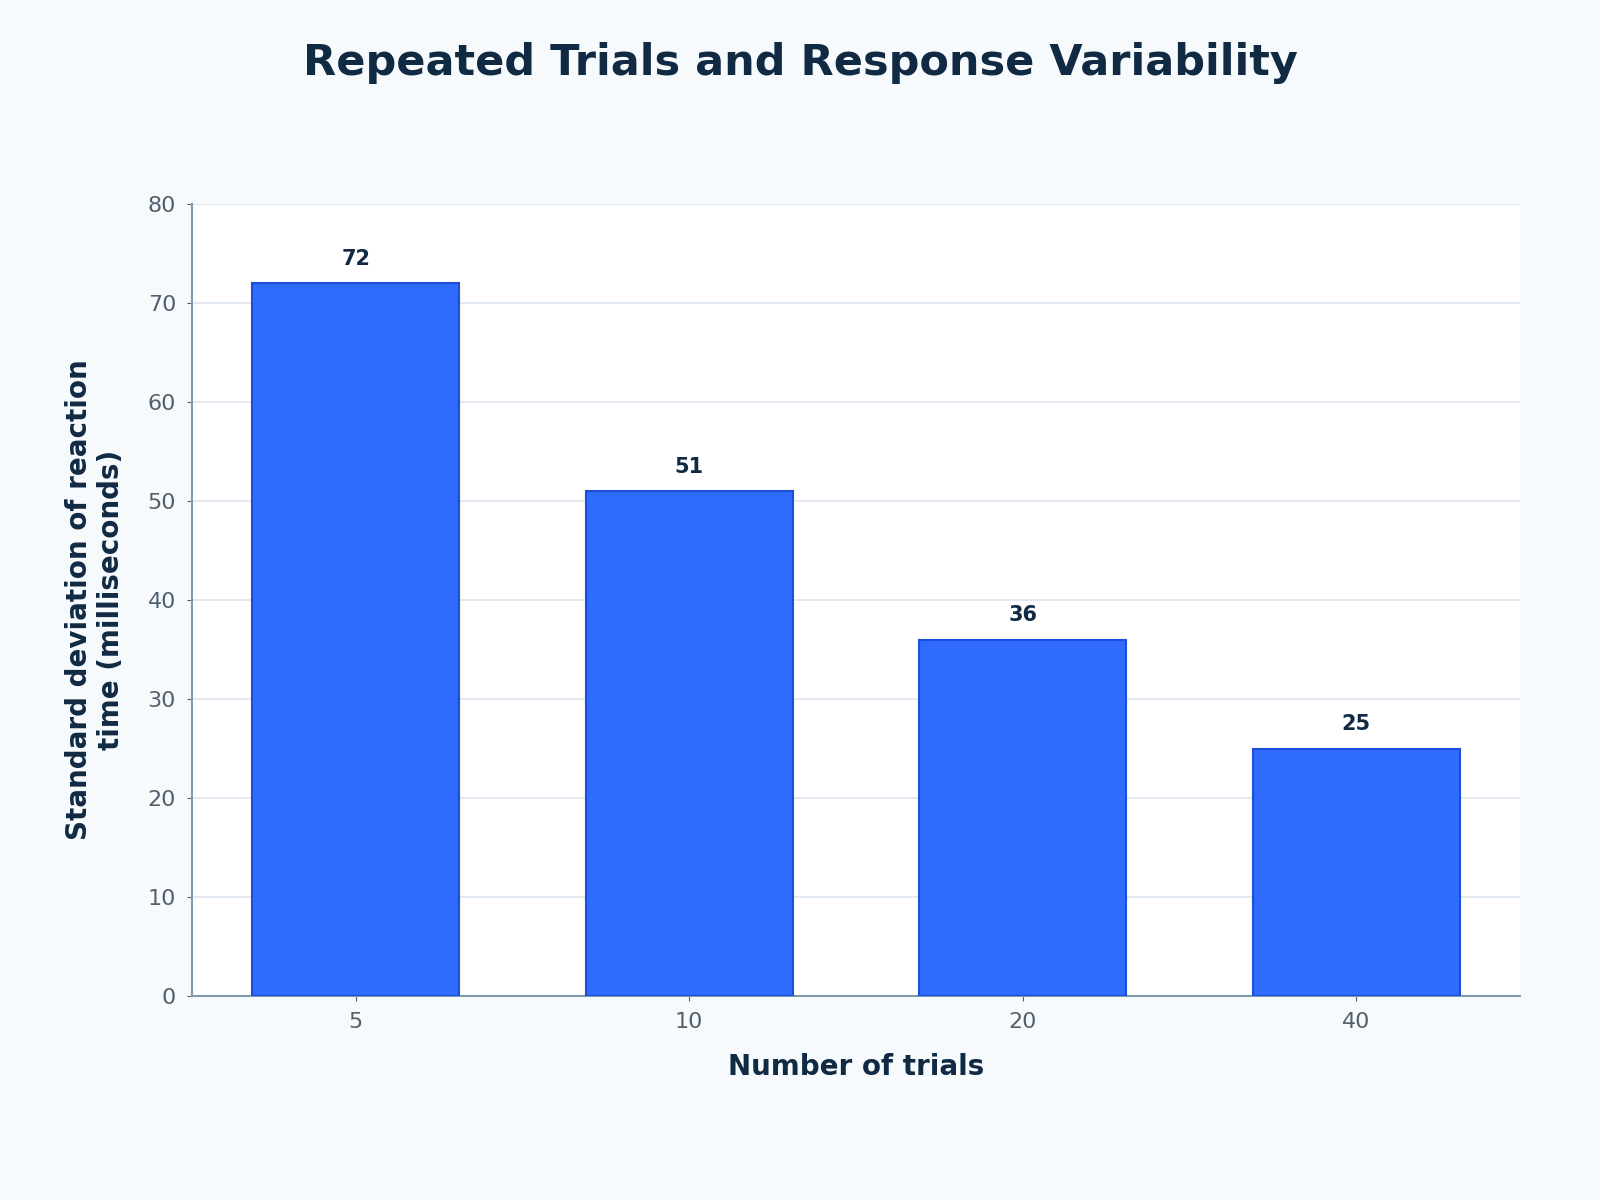
A researcher summarizes AP Psychology data in the accompanying chart titled Repeated Trials and Response Variability. The displayed values show standard deviations of reaction time across 5, 10, 20, and 40 trials of 72, 51, 36, and 25 milliseconds. Which statement accurately describes the data?