APG.015 Evaluate Limitations of Data Visualizations
0%
Skill Level🔴 Hard
00:00
Progress to Next Level25% to Medium
EasyMediumHardMastery100%
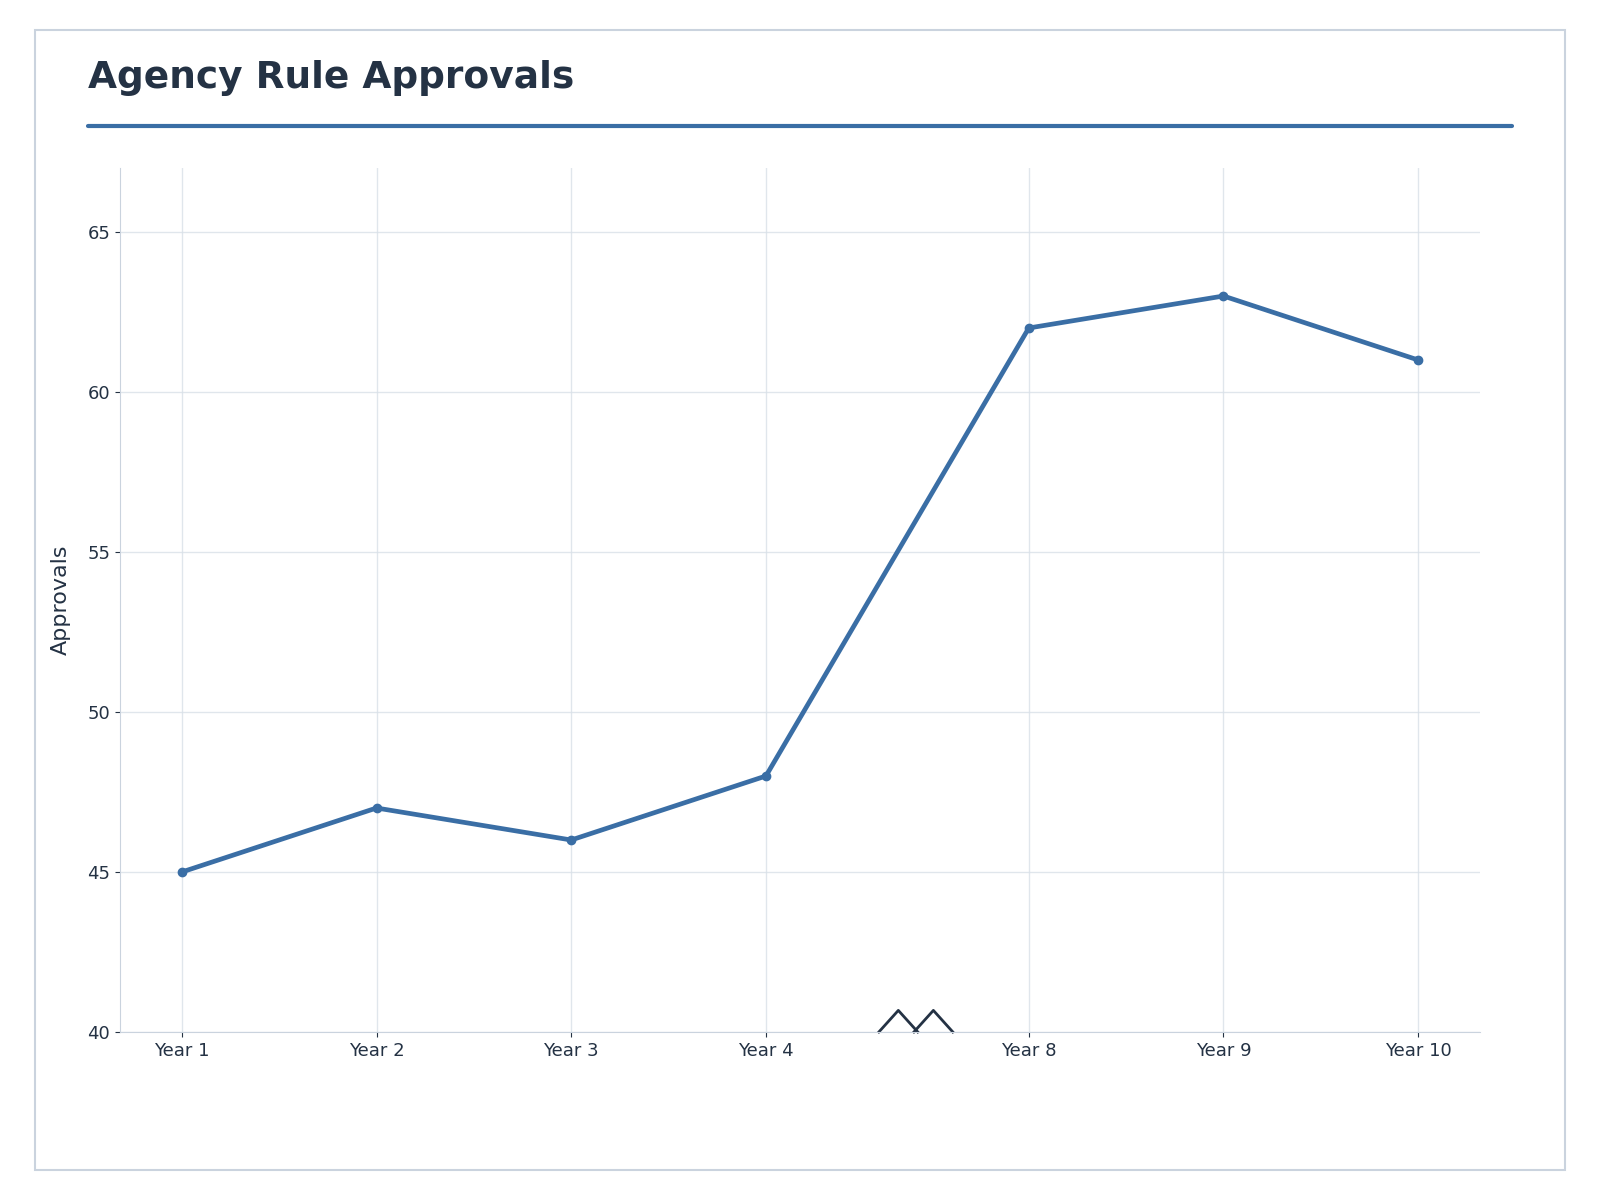
A time-series chart of agency rule approvals has a break in the x-axis between Year 4 and Year 8, but the break is shown only by a tiny zigzag mark. What limitation could mislead readers?