APUSH.020 Interpret Quantitative Evidence
0%
Skill Level🔴 Hard
00:00
Progress to Next Level25% to Medium
EasyMediumHardMastery100%
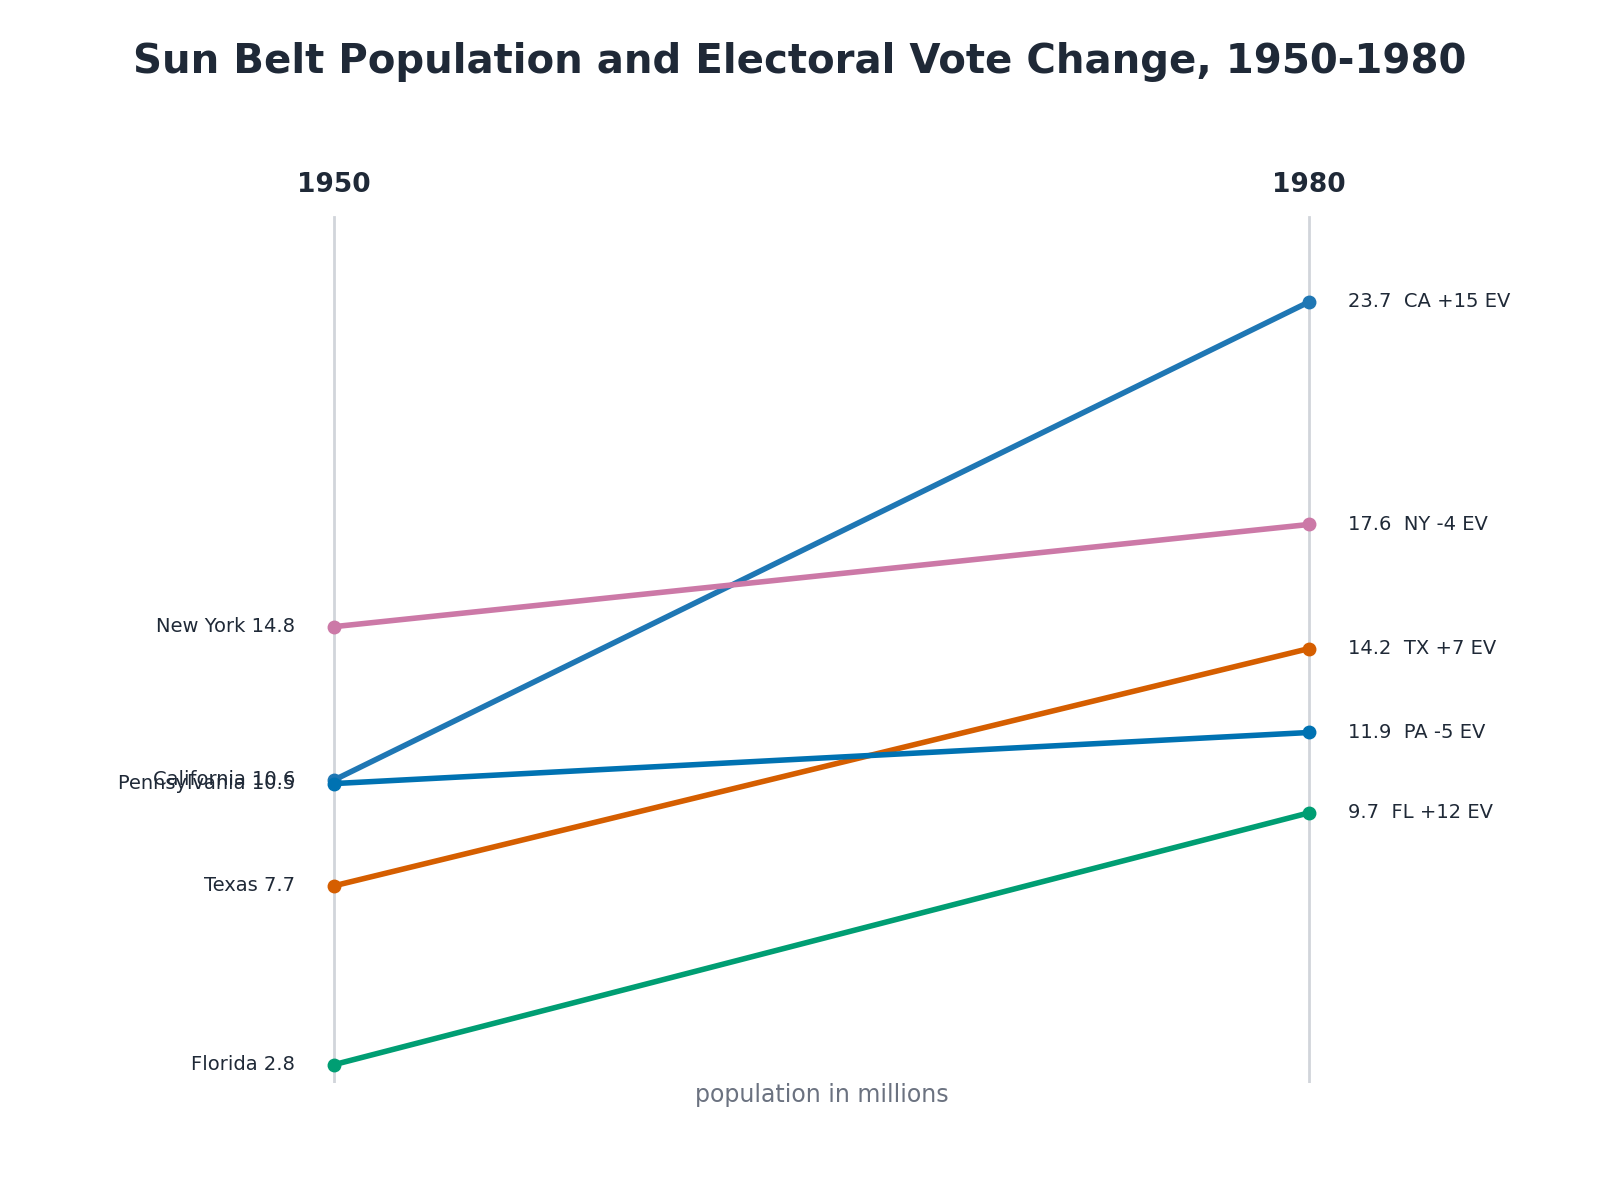
Use the accompanying slope chart titled "Sun Belt Population and Electoral Vote Change, 1950-1980." Which conclusion is best supported by the data?