DI.151 Bubble Charts and Size Encodings
0%
Skill Level🔴 Hard
00:00
Progress to Next Level25% to Medium
EasyMediumHardMastery100%
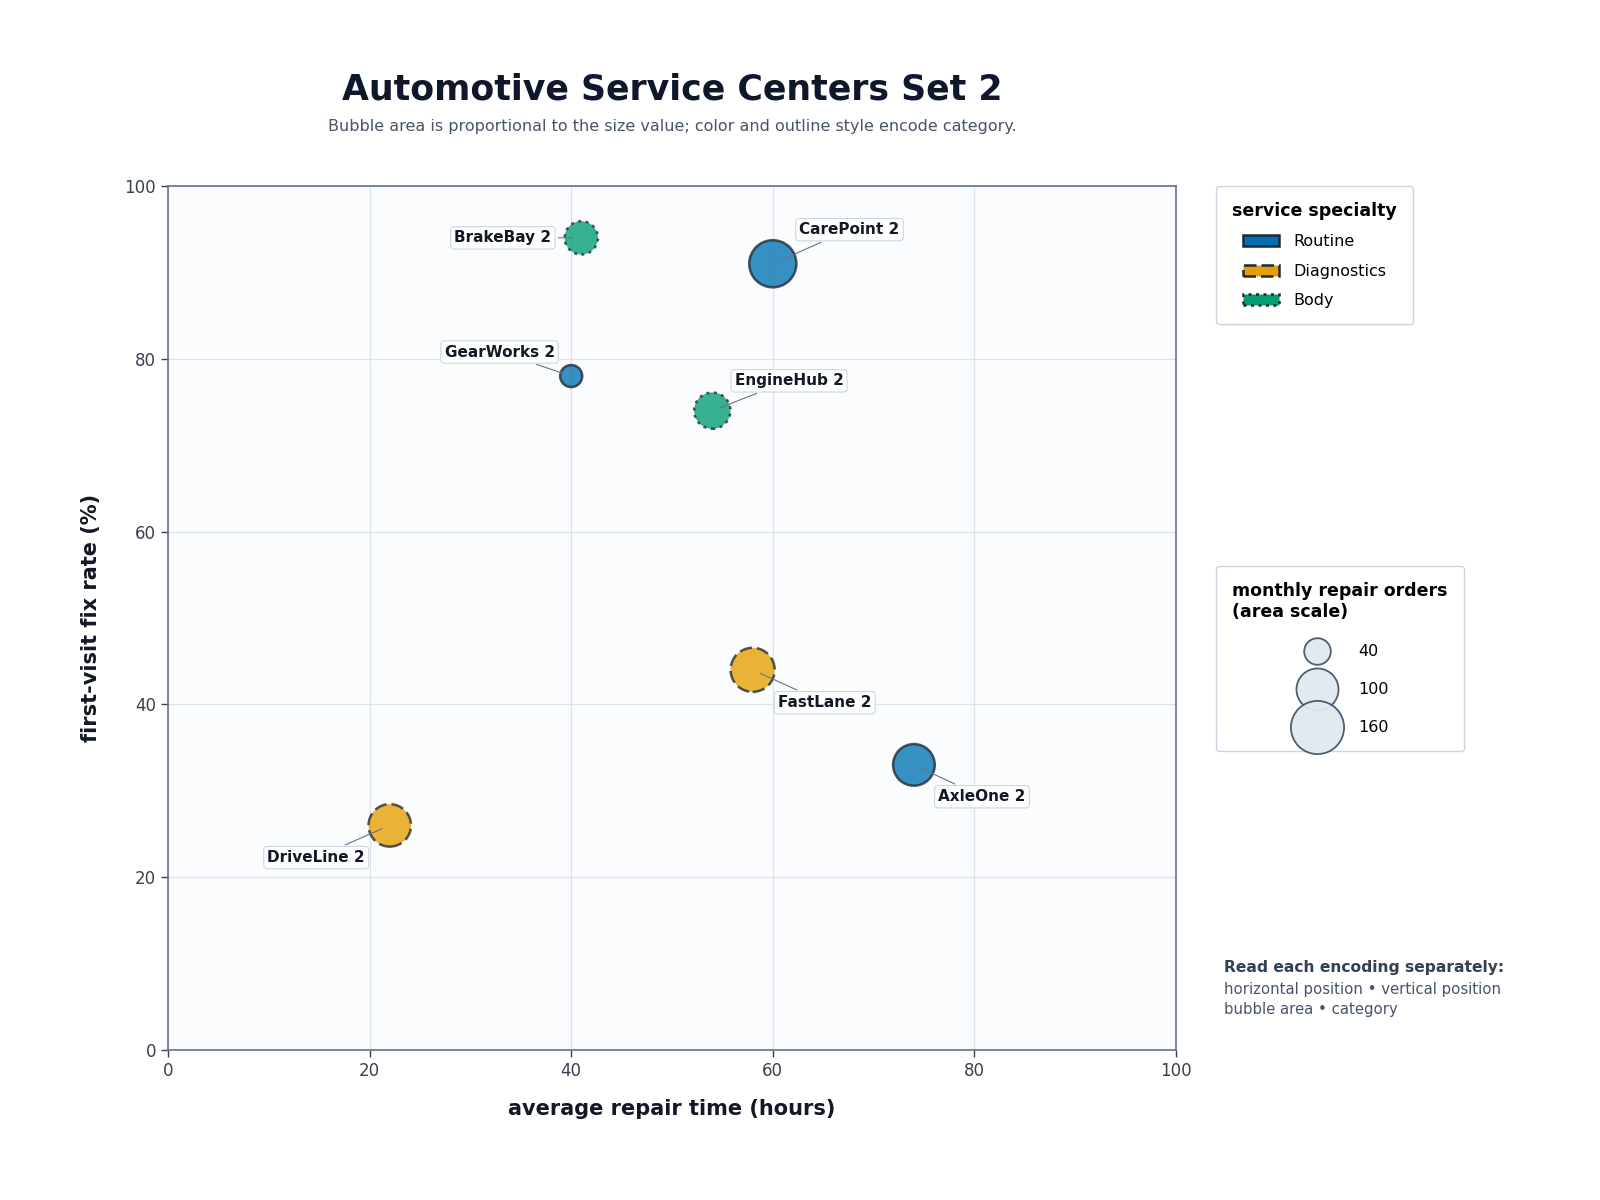
Use the bubble chart titled Automotive Service Centers Set 2. Horizontal position represents average repair time (hours); vertical position represents first-visit fix rate (%); bubble area represents monthly repair orders; color represents service specialty. Which bubble has the strongest vertical value after penalizing distance from the center x-value of 50?