GMAT.217 Histograms and Distribution Curves
0%
Skill Level🔴 Hard
00:00
Progress to Next Level25% to Medium
EasyMediumHardMastery100%
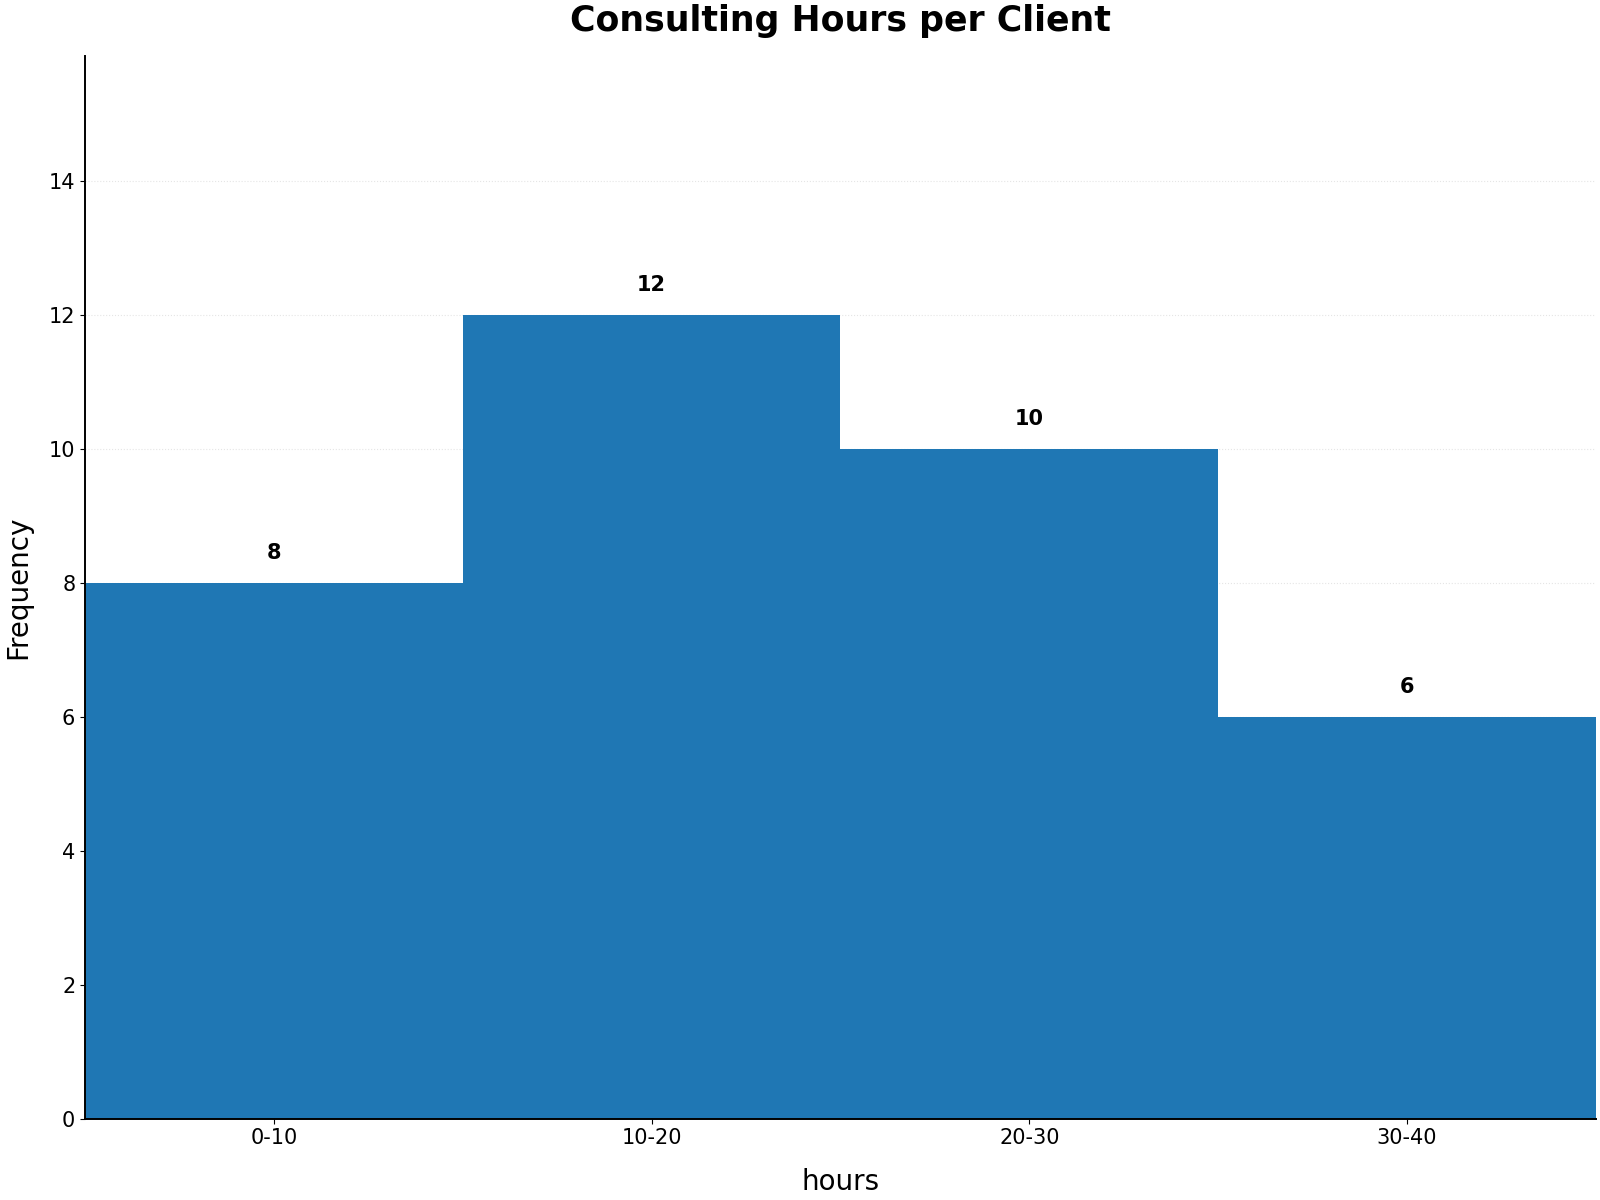
Exhibit: Histogram titled Consulting Hours per Client. The x-axis is hours; the y-axis is frequency. Bin frequencies are 0-10: 8; 10-20: 12; 20-30: 10; 30-40: 6. Equal-width bins are shown unless stated otherwise. Using bin midpoints, which bin contributes the most to the estimated total number of hours?