GMAT.226 Integrating Text, Tables, and Graphics
0%
Skill Level🔴 Hard
00:00
Progress to Next Level25% to Medium
EasyMediumHardMastery100%
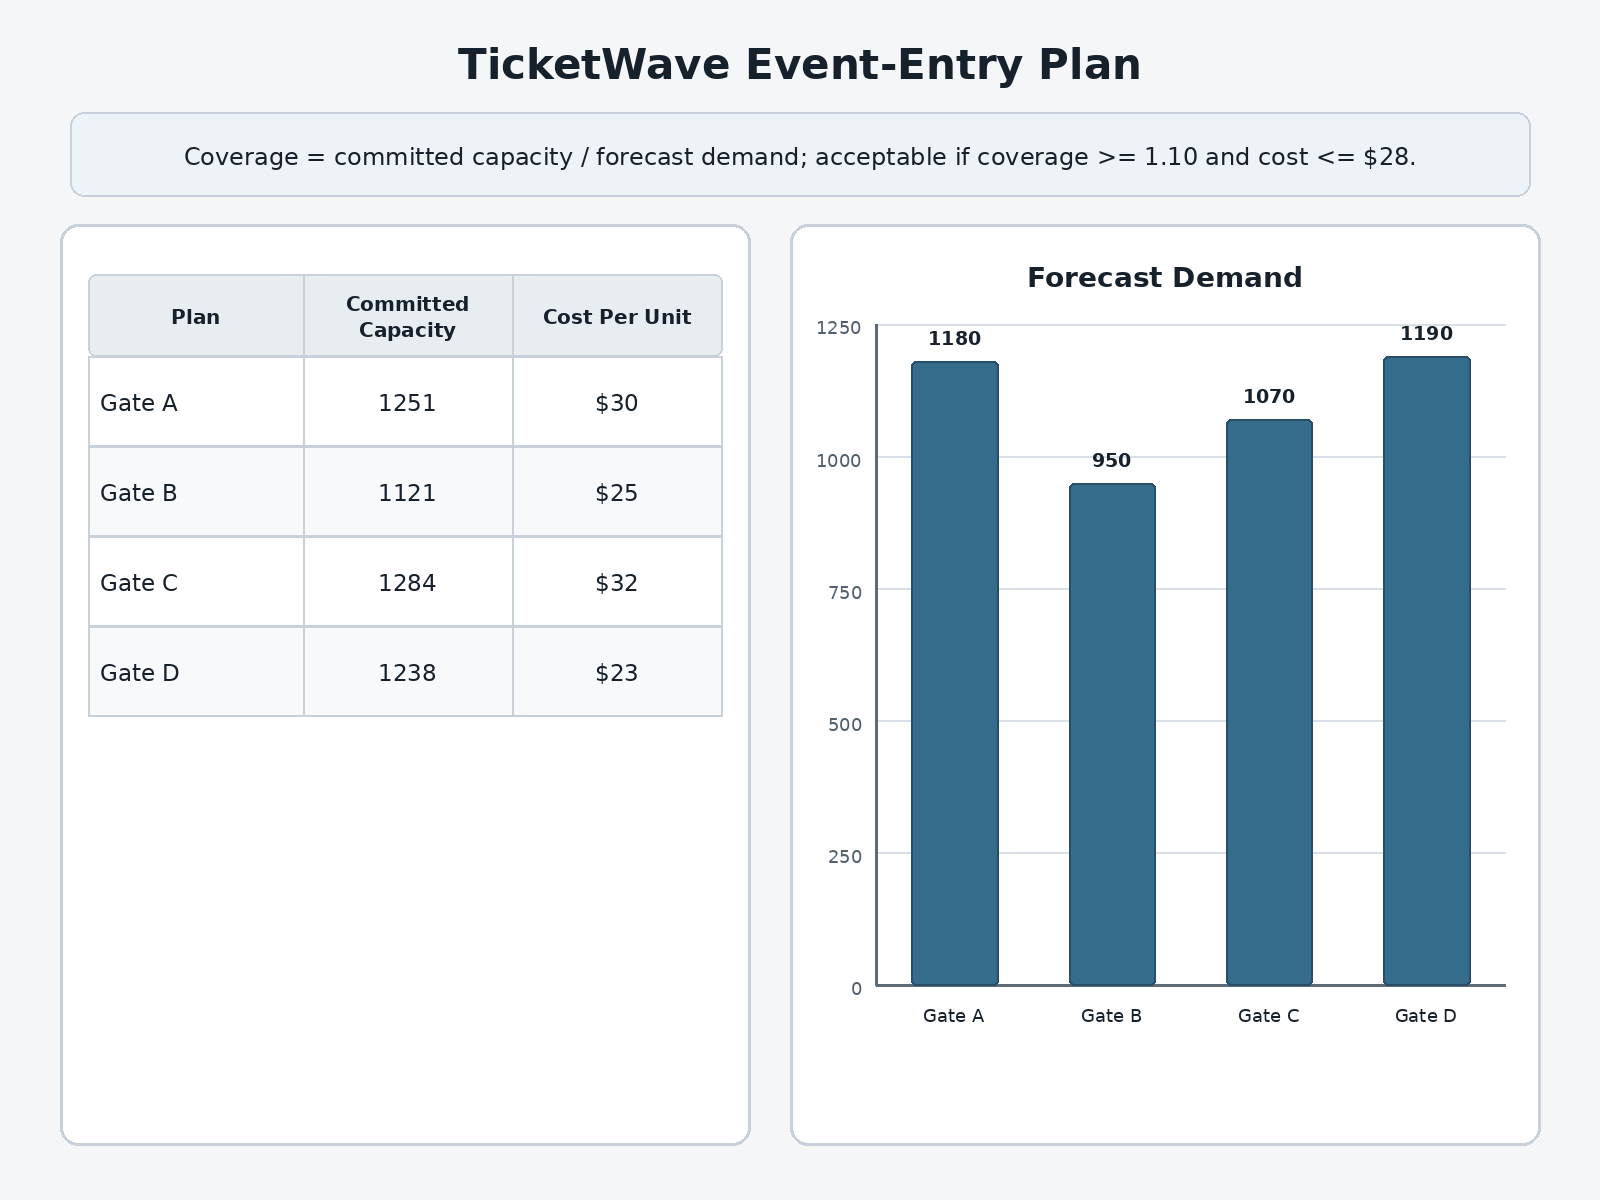
Exhibit: TicketWave is reviewing the event-entry plan. Memo: A plan is acceptable only if coverage ratio, defined as committed capacity from the table divided by forecast demand from the chart, is at least 1.10 and cost per unit is no more than $28. Source 1 table: Gate A: committed capacity 1251, cost per unit $30; Gate B: committed capacity 1121, cost per unit $25; Gate C: committed capacity 1284, cost per unit $32; Gate D: committed capacity 1238, cost per unit $23. Source 2 bar chart: Gate A: forecast demand 1180; Gate B: forecast demand 950; Gate C: forecast demand 1070; Gate D: forecast demand 1190. Which conclusion correctly integrates the memo, table, and chart?