GMAT.209 Rank, Median, Percentile, and Distribution
0%
Skill Level🔴 Hard
00:00
Progress to Next Level25% to Medium
EasyMediumHardMastery100%
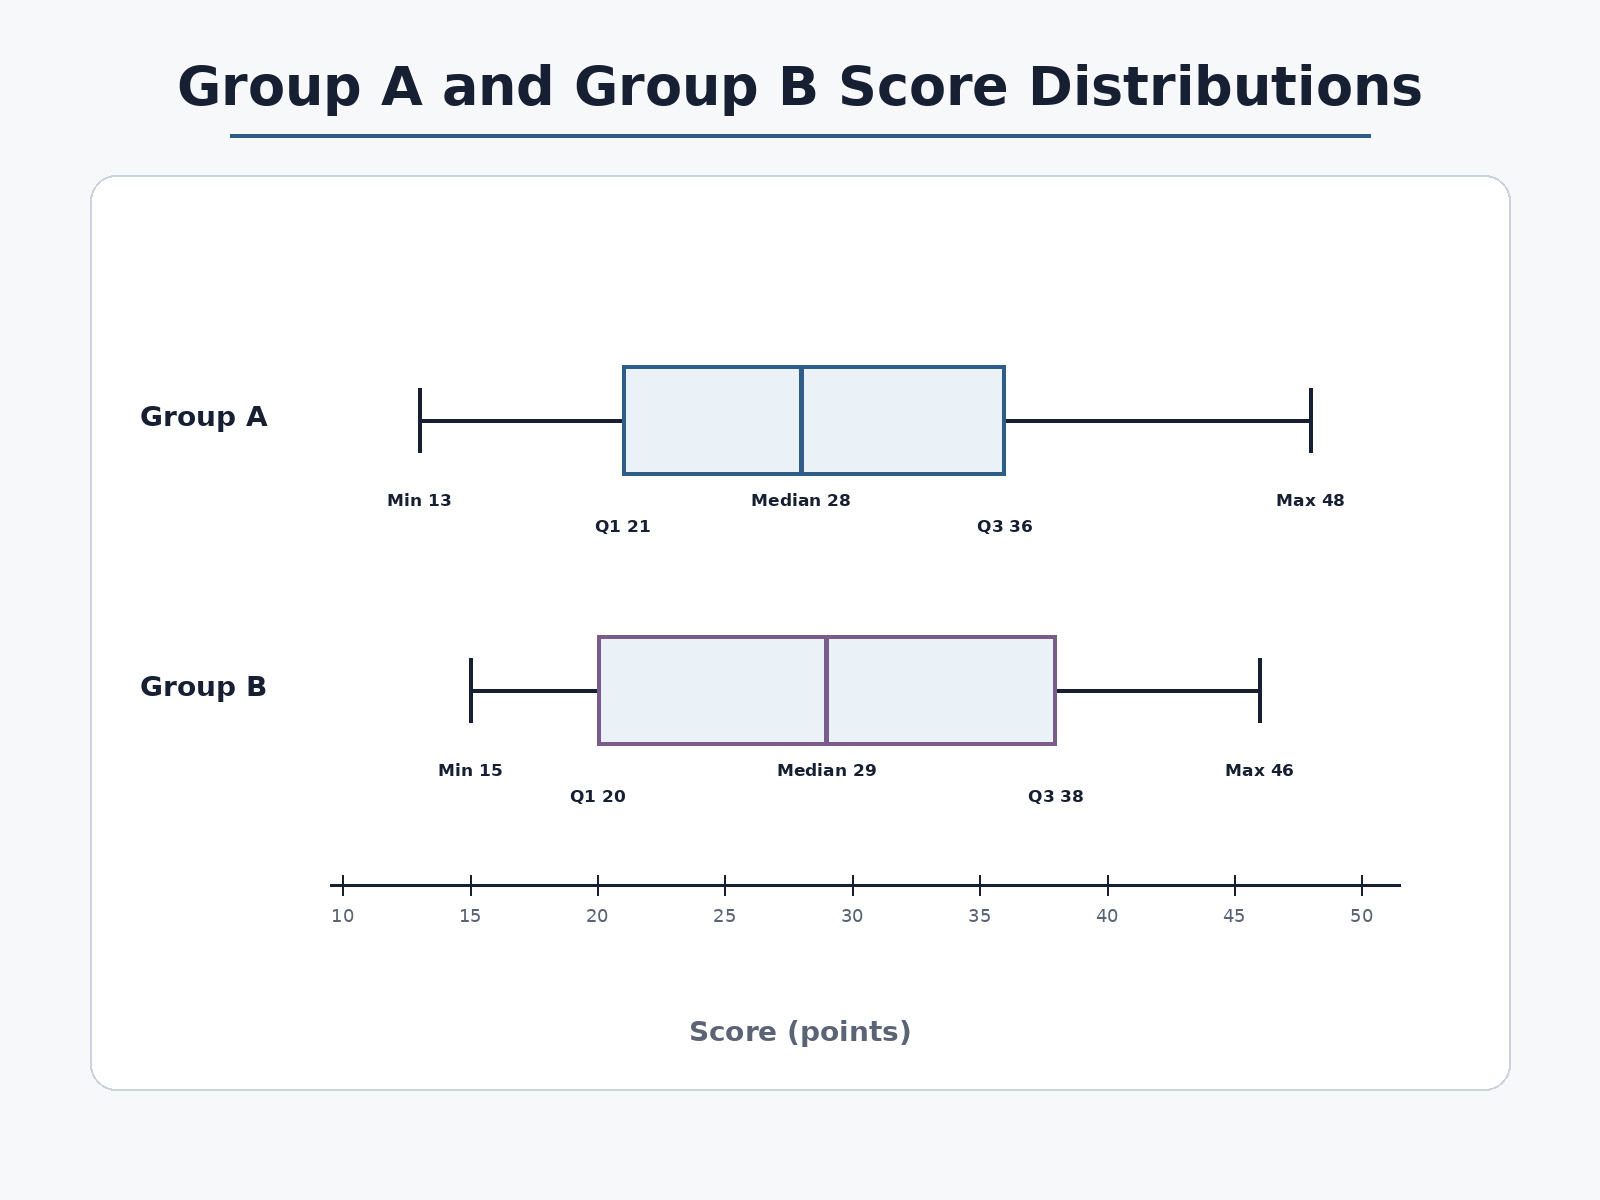
Graphics Interpretation exhibit: Two horizontal box plots show score distributions. Group A has min 13, Q1 21, median 28, Q3 36, max 48. Group B has min 15, Q1 20, median 29, Q3 38, max 46. Which statement correctly compares rank, median, or spread?