GMAT.210 Time-Series Tables and Trend Comparison
0%
Skill Level🔴 Hard
00:00
Progress to Next Level25% to Medium
EasyMediumHardMastery100%
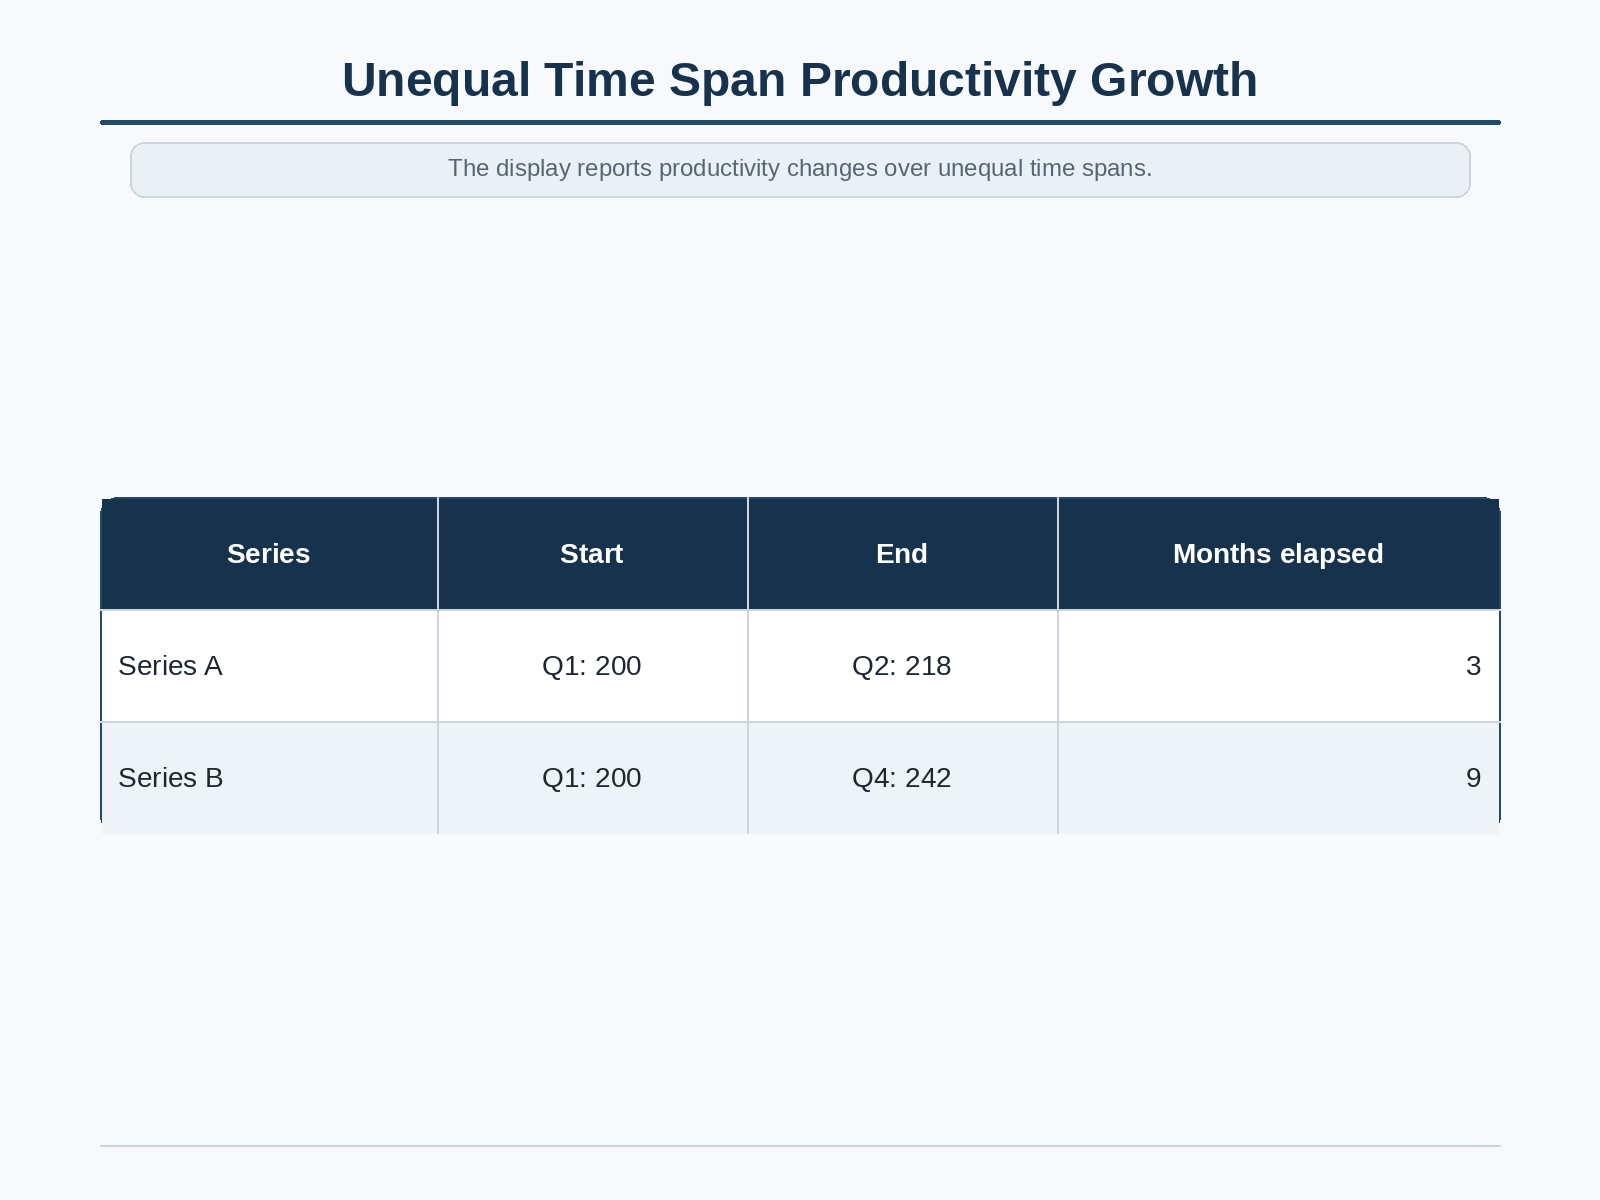
Data display: Unequal Time Span Productivity Growth. Columns: Series | Start | End | Months elapsed; Rows: Series A | Q1: 200 | Q2: 218 | 3; Series B | Q1: 200 | Q4: 242 | 9. The display reports productivity changes over unequal time spans. Which conclusion is best supported?