Skip to content
free
K
1
2
practice
Home
Math
English
Science
Social Studies
Contact
Language
English
Español
Sign In
/
College Test Prep
/
GRE
/
Scatterplots: Direction, Form, Strength, and Outliers
Grade Level
GRE
GRE.067 Scatterplots: Direction, Form, Strength, and Outliers
0%
Skill Level
🔴 Hard
00:00
Progress to Next Level
25% to Medium
Easy
Medium
Hard
Mastery
100%
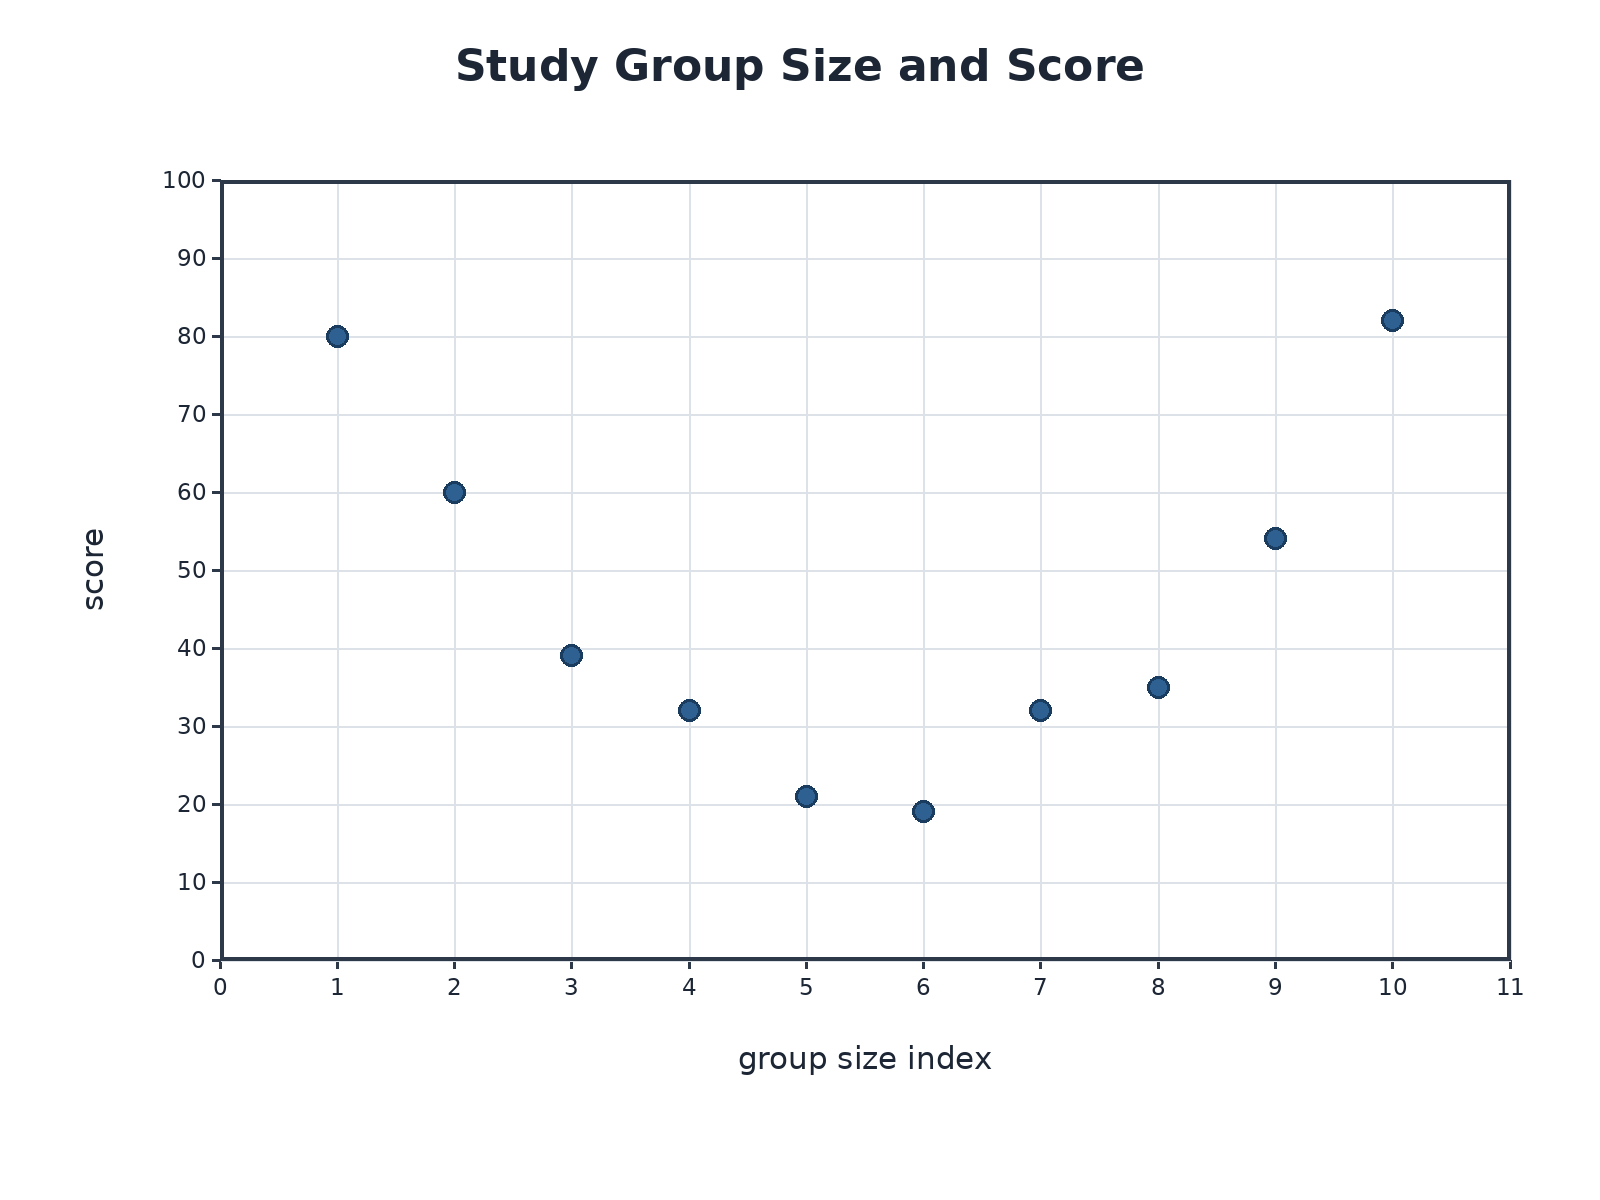
Which statement best describes why the plot is not simply negative?
A
The right side continues decreasing at the same rate.
B
The points are all arranged in a horizontal line.
C
The plot proves group size has no association with score.
D
After the middle x-values, the y-values begin increasing again.
Submit Answer