Skip to content
free
K
1
2
practice
Home
Math
English
Science
Social Studies
Contact
Language
English
Español
Sign In
/
Science
/
Grade 6
/
Microscopy Skills
Worksheet
Grade Level
Grade 6
6.74 Microscopy Skills
0%
Skill Level
🔴 Hard
00:00
Progress to Next Level
25% to Medium
Easy
Medium
Hard
Mastery
100%
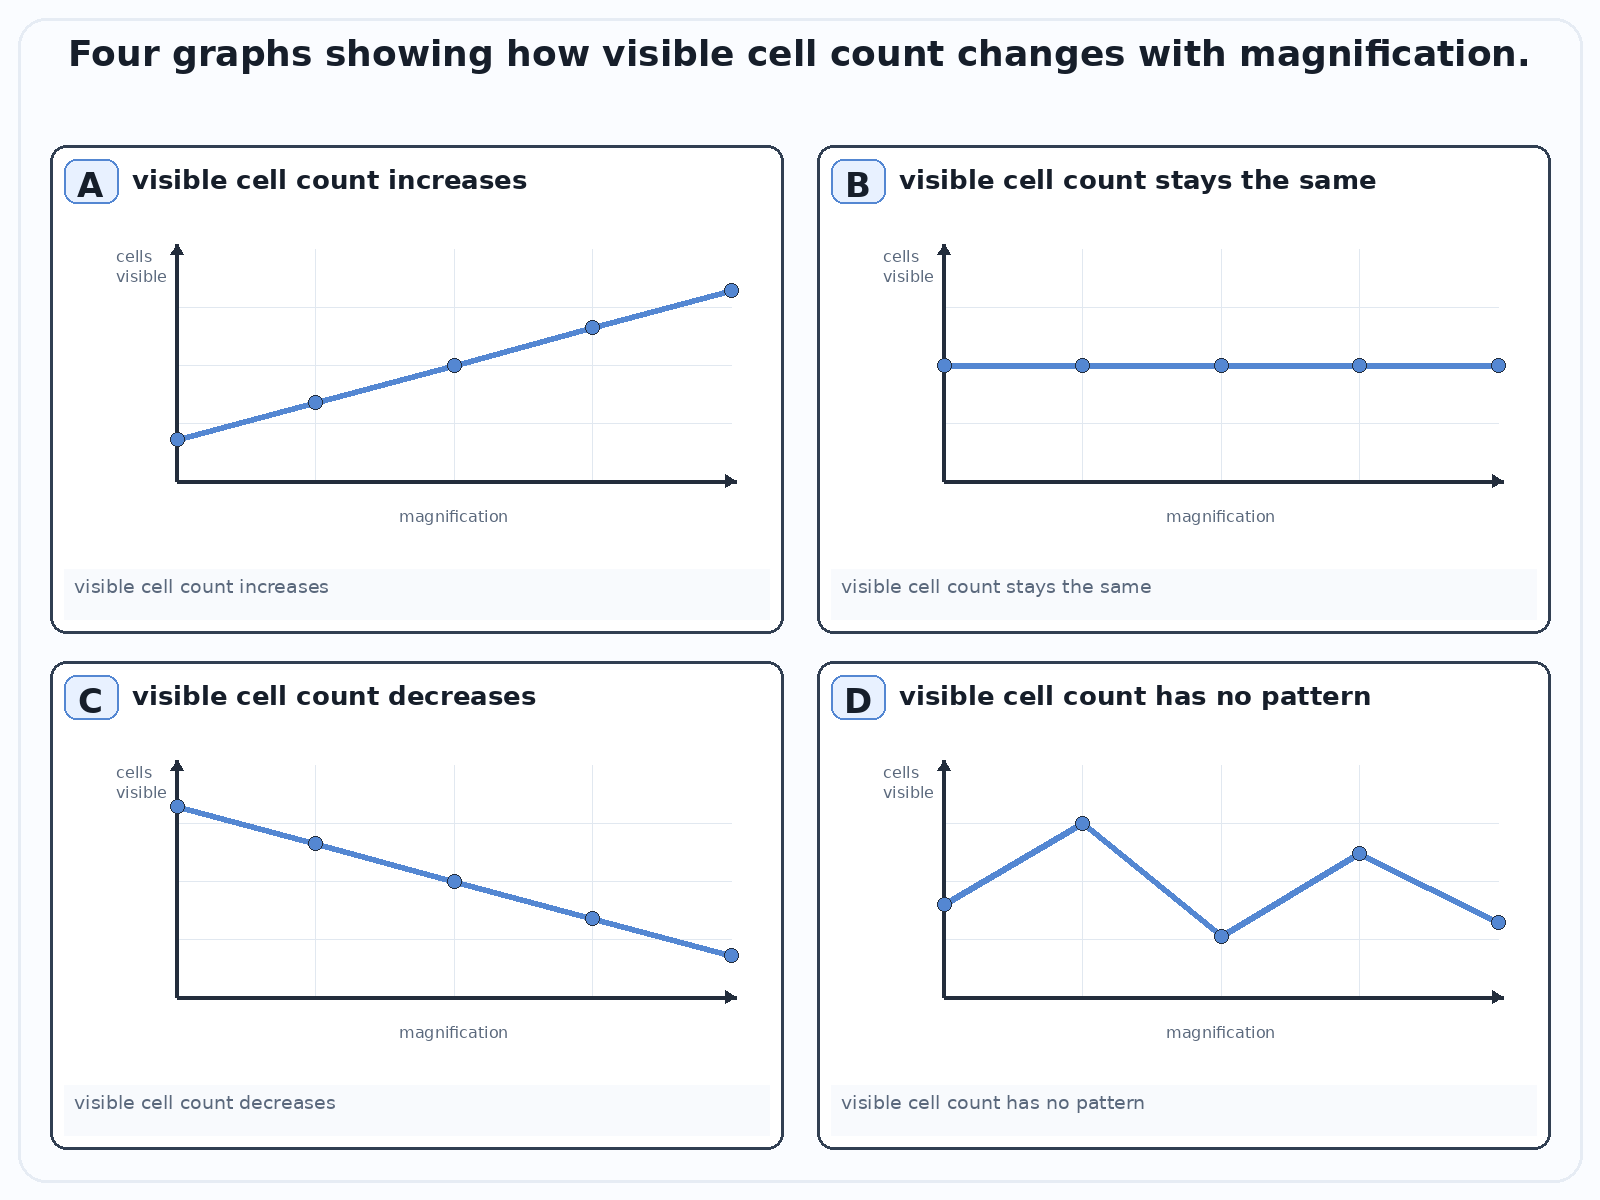
Which graph best represents how the number of cells visible in one field of view changes as magnification increases?
A
the number of visible cells increases steadily
B
the number of visible cells stays the same
C
the number of visible cells decreases as magnification increases
D
the number of visible cells changes with no pattern
Submit Answer