6.14 Use Spreadsheets or Graphing Tools to Visualize Data
0%
Skill Level🔴 Hard
00:00
Progress to Next Level25% to Medium
EasyMediumHardMastery100%
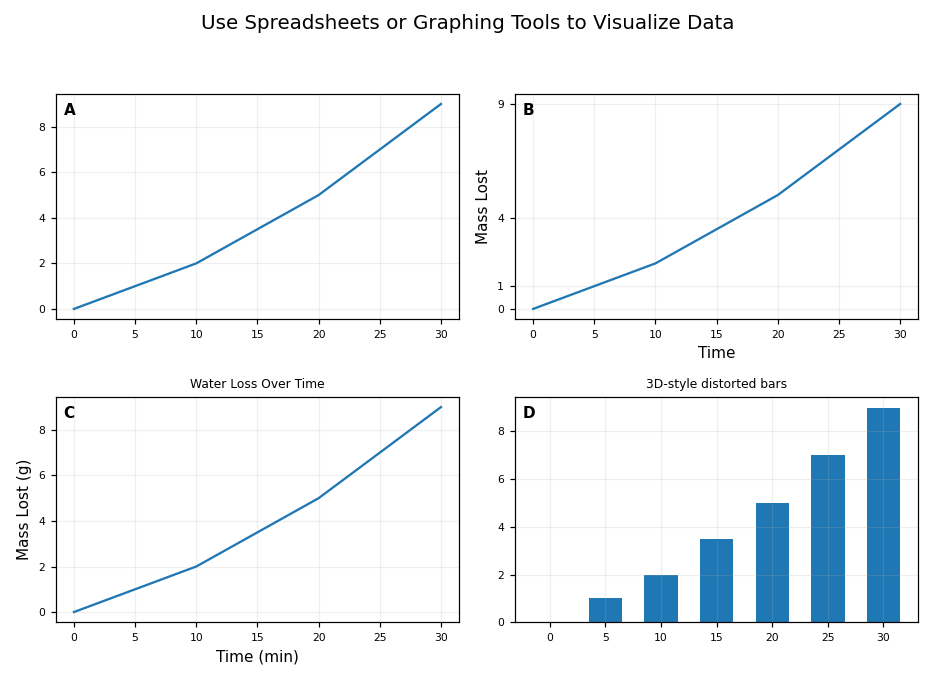
The image shown includes four graphs of the same lab data. Which graph is the scientifically strongest because it has a clear title, labeled axes with units, and equal intervals?