Skip to content
free
K
1
2
practice
Home
Math
English
Science
Social Studies
Contact
Language
English
Español
Sign In
/
Science
/
Grade 8
/
Interpret Temperature–Time Graphs
Worksheet
Grade Level
Grade 8
8.65 Interpret Temperature–Time Graphs
0%
Skill Level
🔴 Hard
00:00
Progress to Next Level
25% to Medium
Easy
Medium
Hard
Mastery
100%
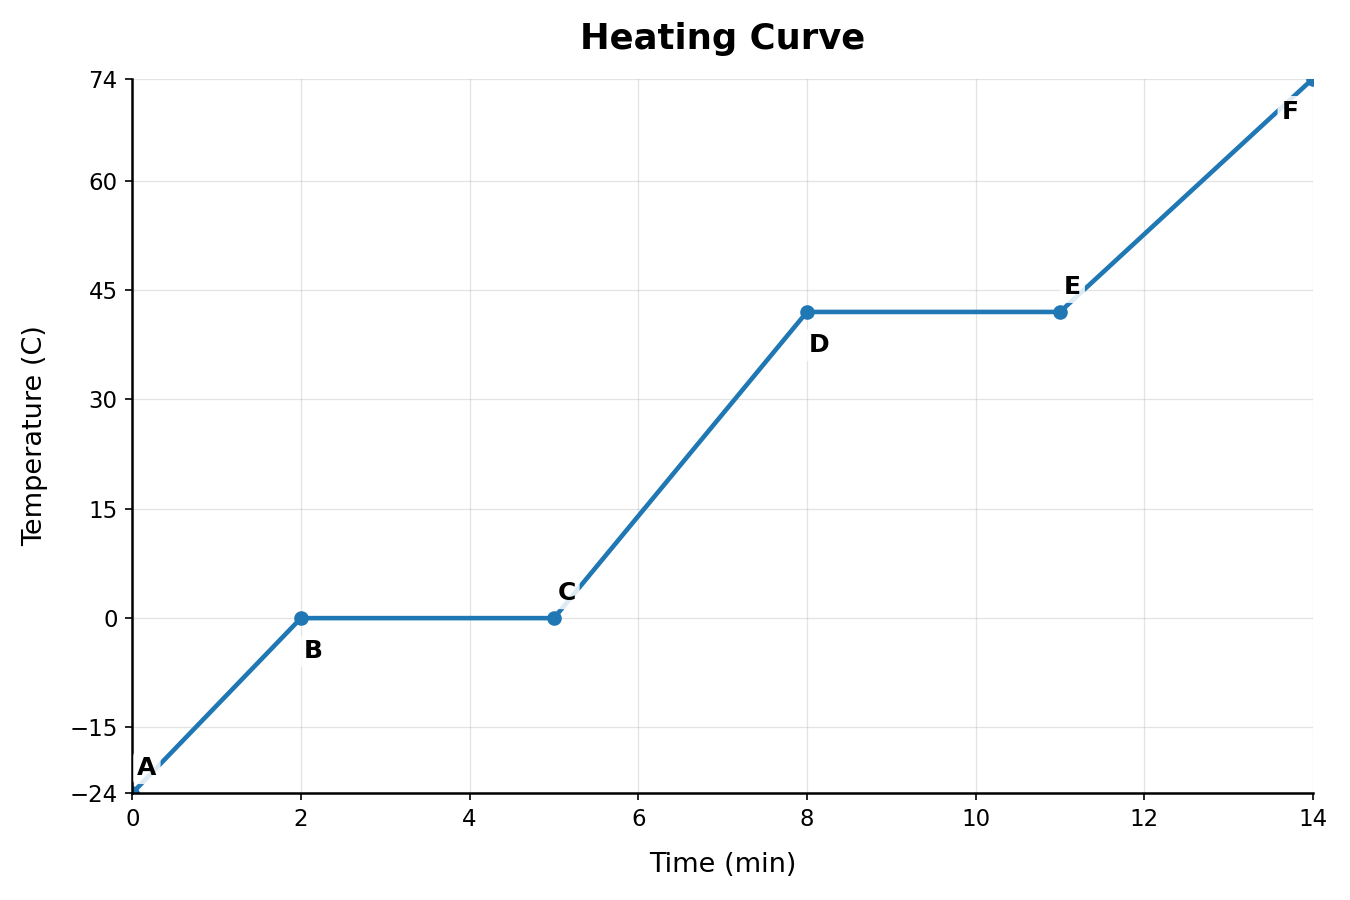
Use the graph. Which statement best compares points C and D?
A
At C the sample is all liquid, and at D the sample is partly solid.
B
At C boiling has started, and at D condensation is happening.
C
At C freezing has just finished, and at D the solid is warming.
D
At C melting has just finished, and at D the liquid is warming.
Submit Answer