9.130 Climate Data and Long-Term Trends
0%
Skill Level🔴 Hard
00:00
Progress to Next Level25% to Medium
EasyMediumHardMastery100%
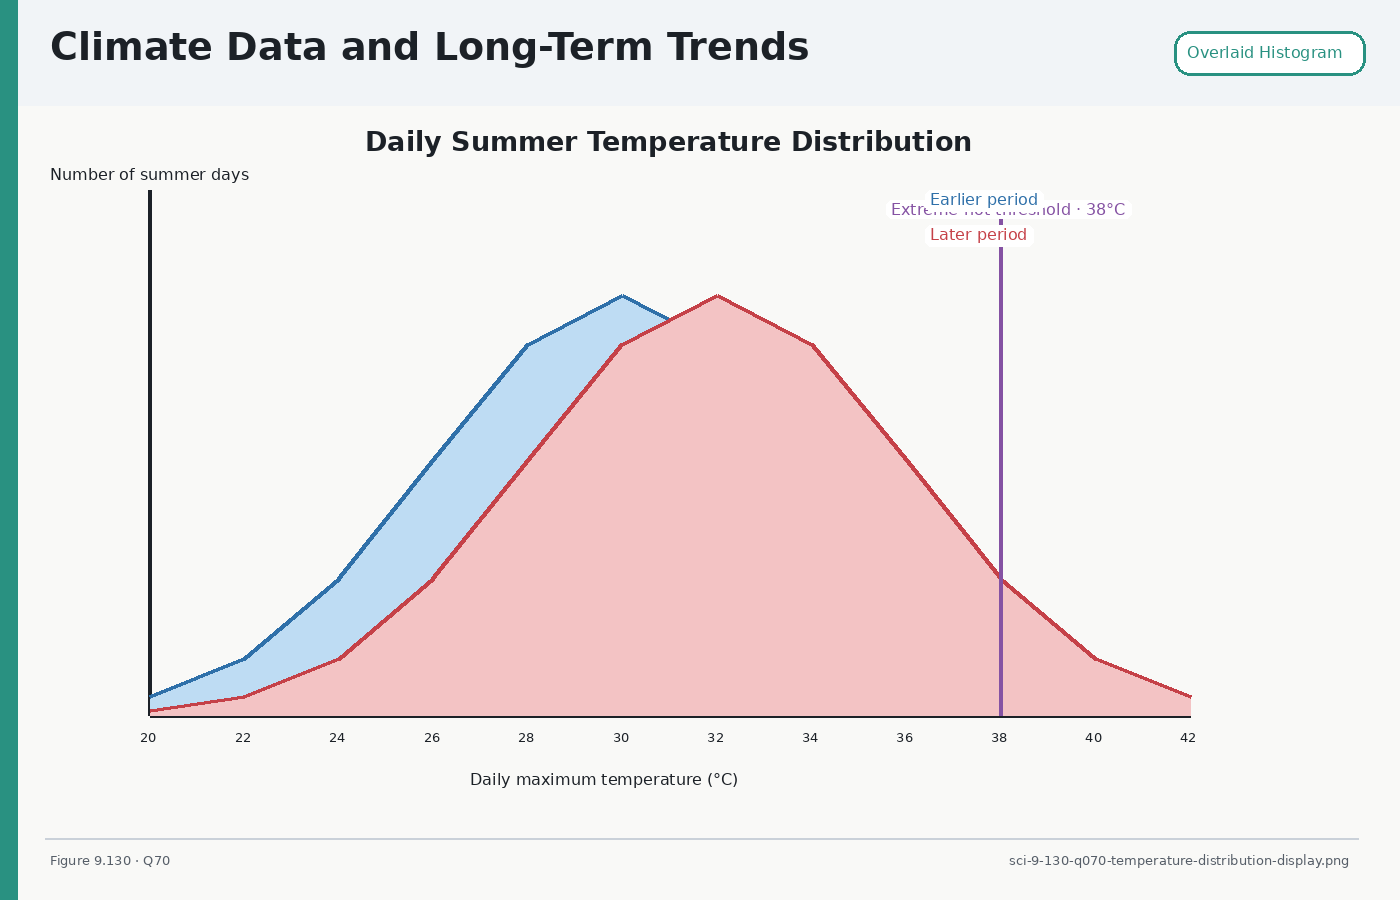
Use the distribution graph to answer the question. The graph compares daily summer temperatures in an earlier period and a later period. Which conclusion best explains why extreme-hot days increased?