9.70 Greenhouse Effect and Planetary Energy Balance
0%
Skill Level🔴 Hard
00:00
Progress to Next Level25% to Medium
EasyMediumHardMastery100%
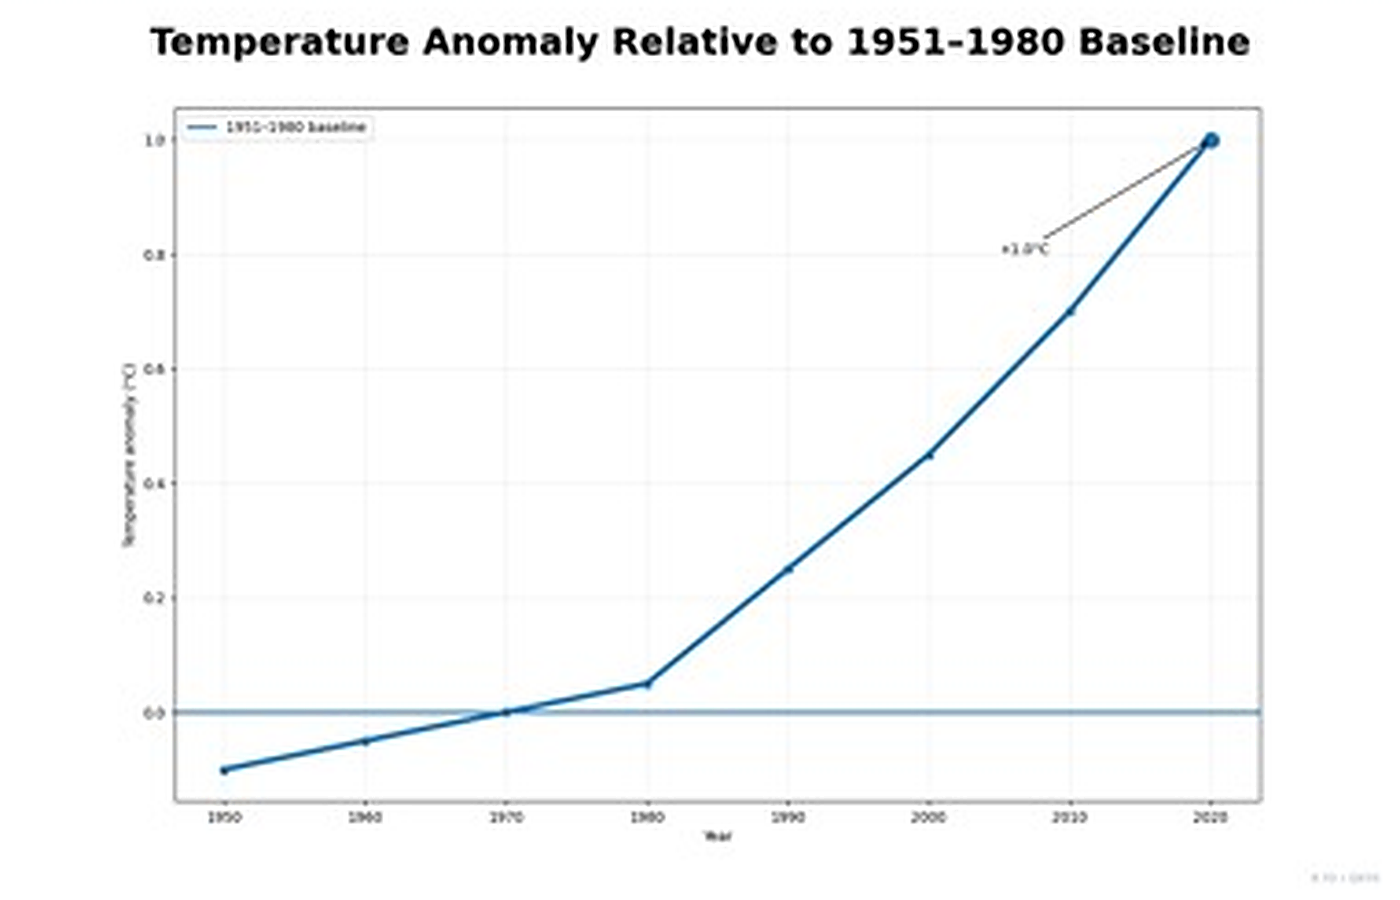
A temperature graph uses a 1951-1980 baseline. What does a temperature anomaly of +1.0 degrees C mean on that graph?