Skip to content
free
K
1
2
practice
Home
Math
English
Science
Social Studies
Contact
Language
English
Español
Sign In
/
Science
/
Physical Science with Earth and Science
/
Hazard Maps and Data Interpretation
Worksheet
Grade Level
Physical Science with Earth and Science
9.119 Hazard Maps and Data Interpretation
0%
Skill Level
🔴 Hard
00:00
Progress to Next Level
25% to Medium
Easy
Medium
Hard
Mastery
100%
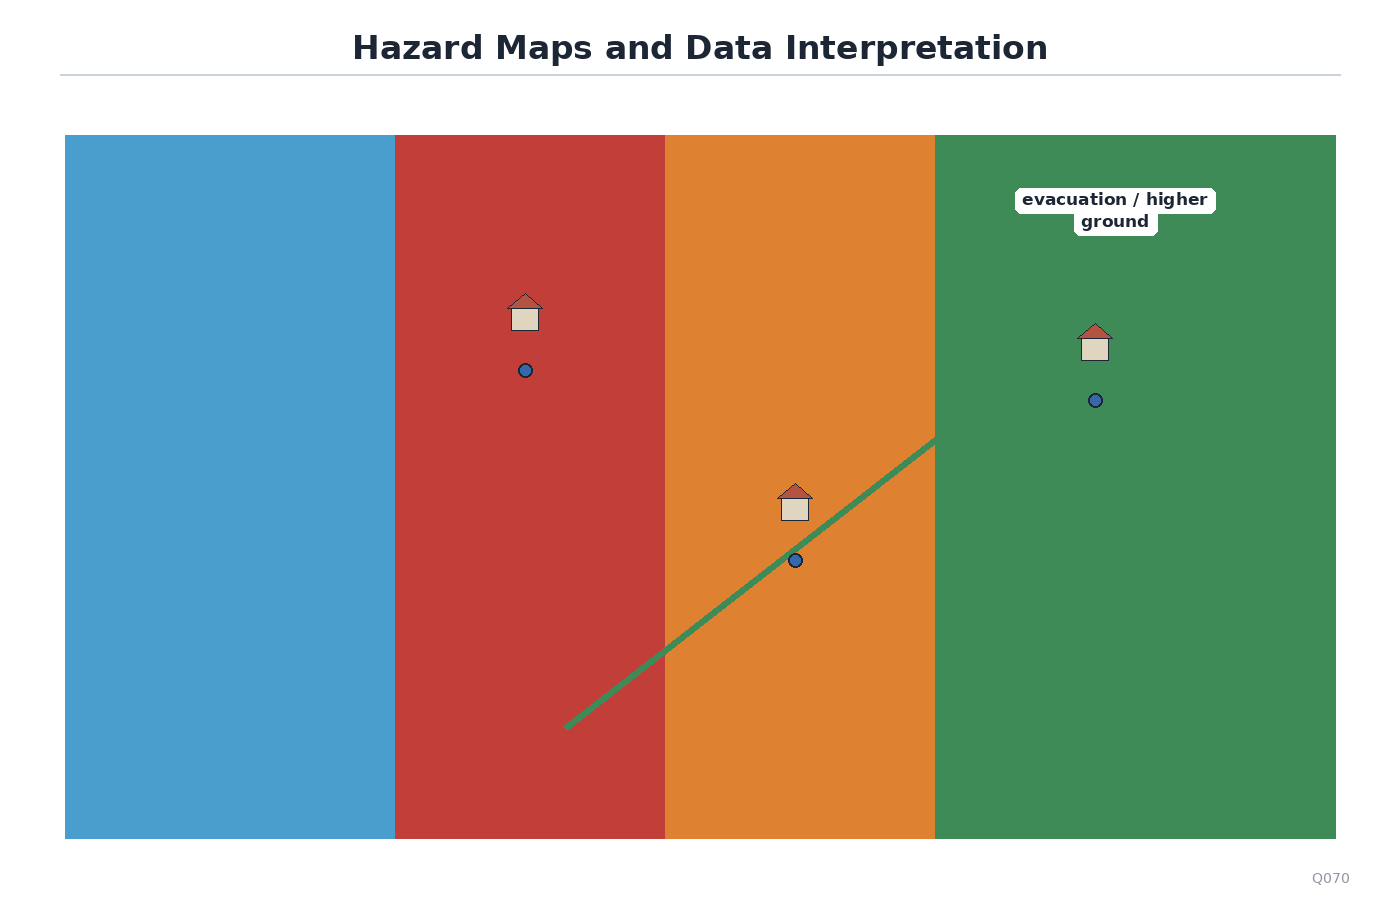
Use the hazard and social vulnerability map. Which claim is the most evidence-based and avoids overstatement?
A
The southeast area may need priority outreach because high flood hazard overlaps high social vulnerability there.
B
The map proves flood hazard was caused by social vulnerability.
C
The southeast area will definitely have the most deaths in every future flood.
D
The northwest area has no risk because its vulnerability index is lower.
Submit Answer