9.17 Phase Changes and Heating-Cooling Curves
0%
Skill Level🔴 Hard
00:00
Progress to Next Level25% to Medium
EasyMediumHardMastery100%
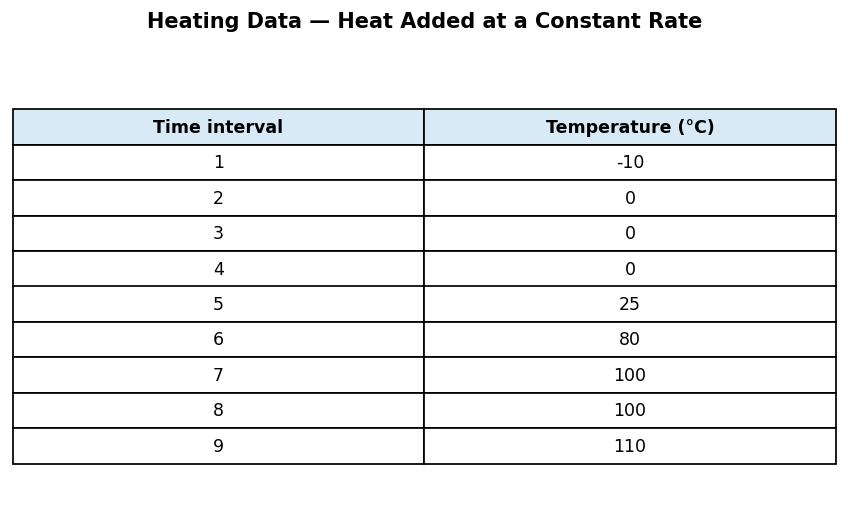
Use the data table for a heated sample. Temperatures are -10, 0, 0, 0, 25, 80, 100, 100, and 110 deg C at equal time intervals. Which phase change is shown by the 0 deg C plateau?