10.36 Use Text Features and Graphics to Interpret Information
0%
Skill Level🔴 Hard
00:00
Progress to Next Level25% to Medium
EasyMediumHardMastery100%
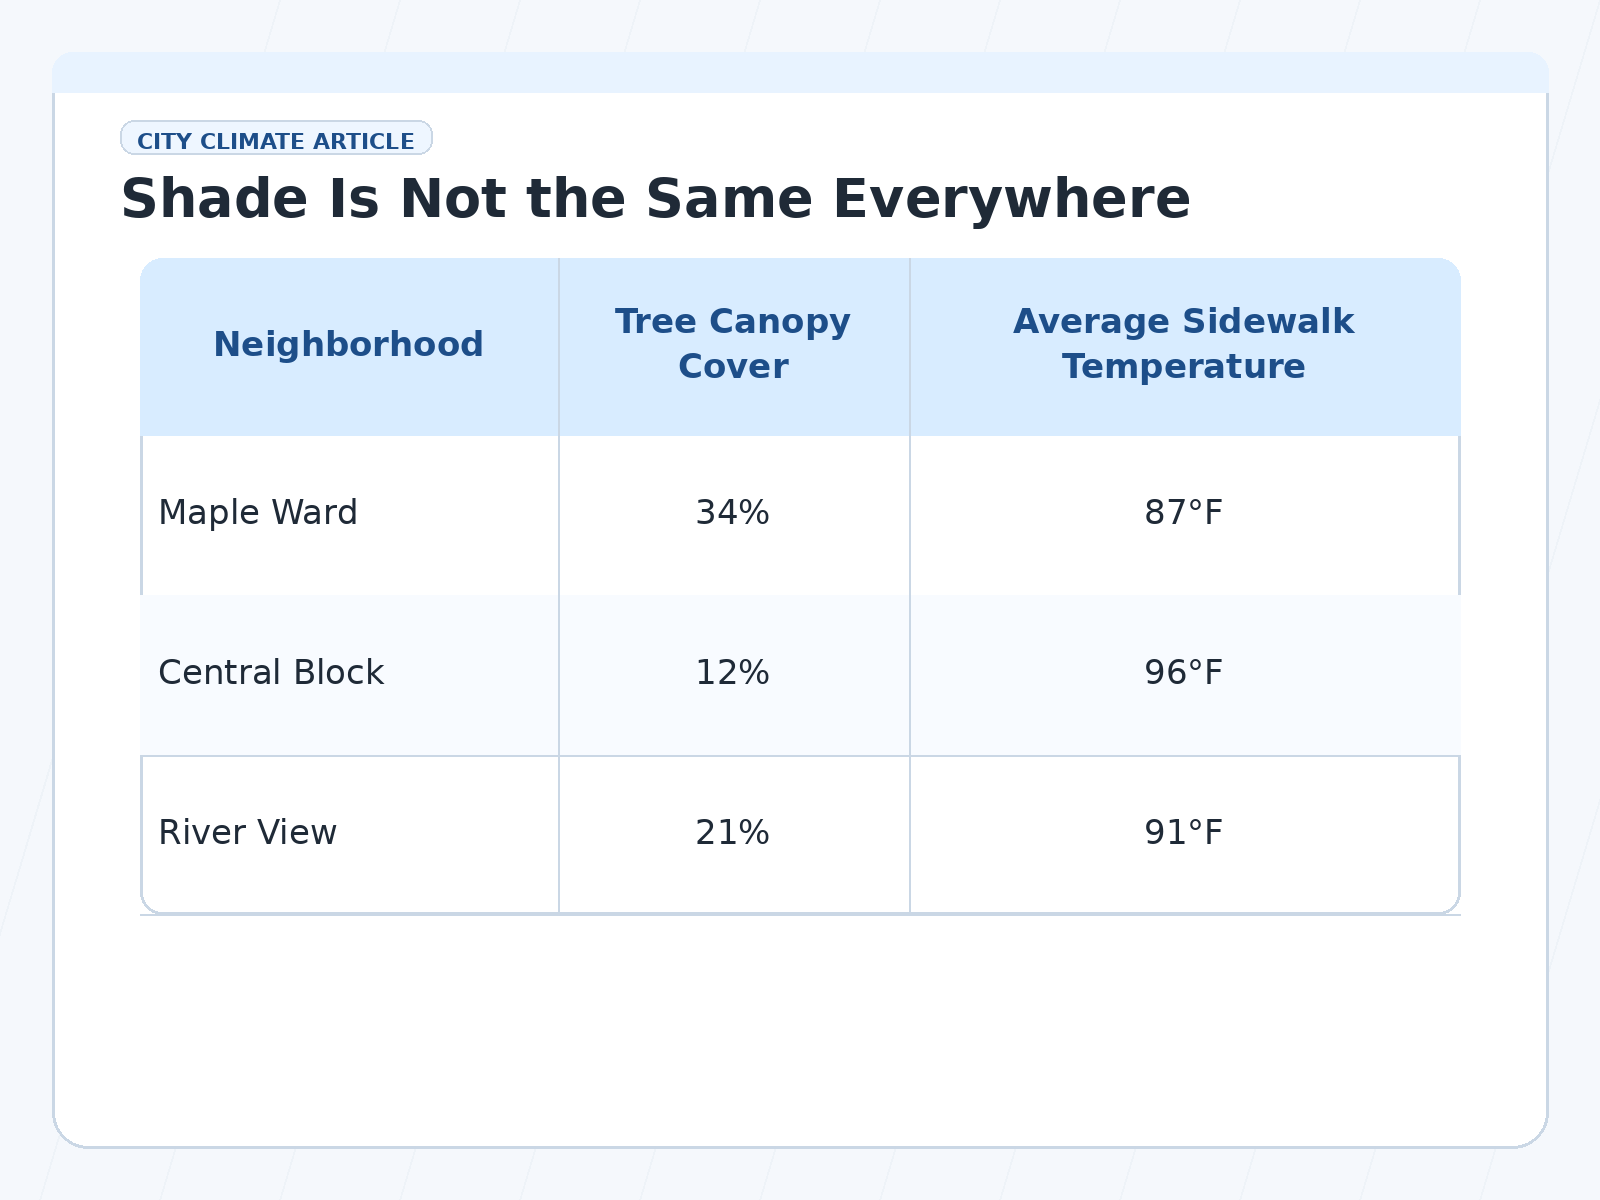
City climate article: Heading: Shade Is Not the Same Everywhere Table: Neighborhood Tree Canopy Cover Average Sidewalk Temperature Maple Ward 34% 87°F Central Block 12% 96°F River View 21% 91°F Which inference is most supported by the heading and the table?