12.25 Interpreting Data, Graphics, and Infographics
0%
Skill Level🔴 Hard
00:00
Progress to Next Level25% to Medium
EasyMediumHardMastery100%
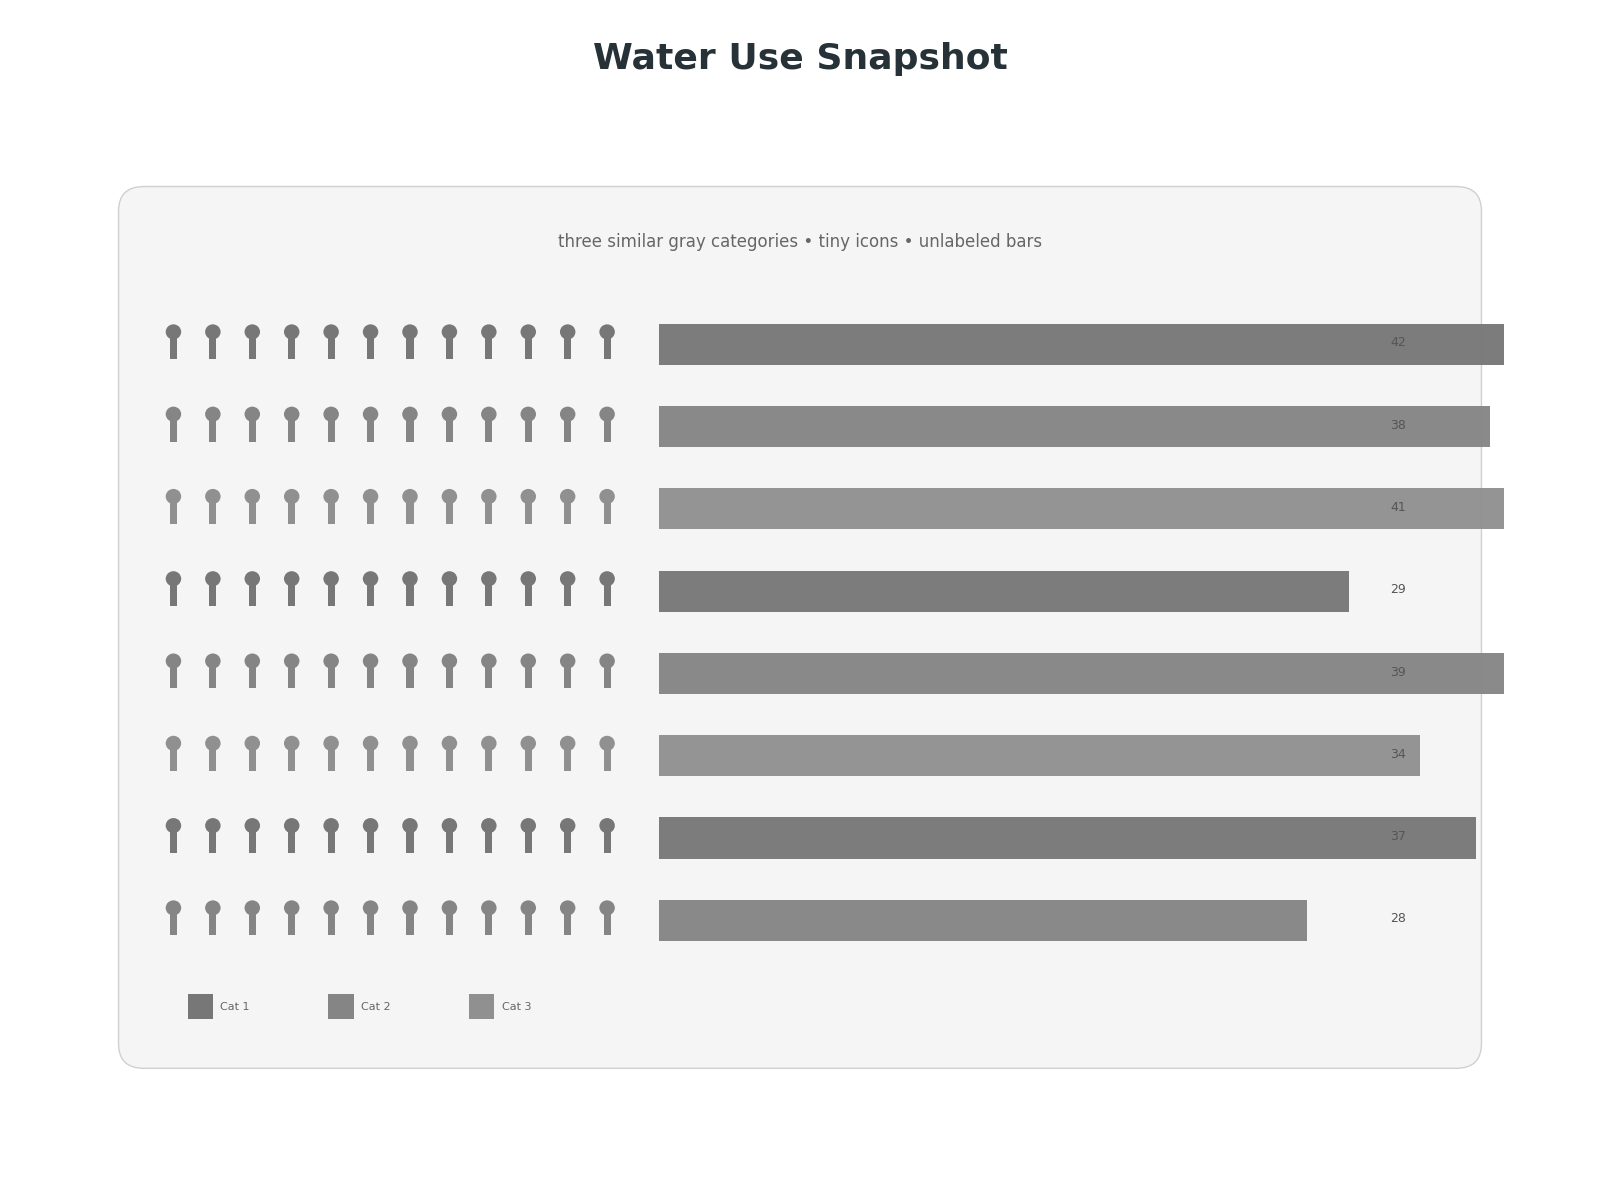
A dense infographic on water use contains three nearly identical gray shades, tiny icons, and bars without direct labels. Which revision would most improve a reader's ability to interpret the evidence?