8.46 Data displays that mislead
0%
Skill Level🔴 Hard
00:00
Progress to Next Level25% to Medium
EasyMediumHardMastery100%
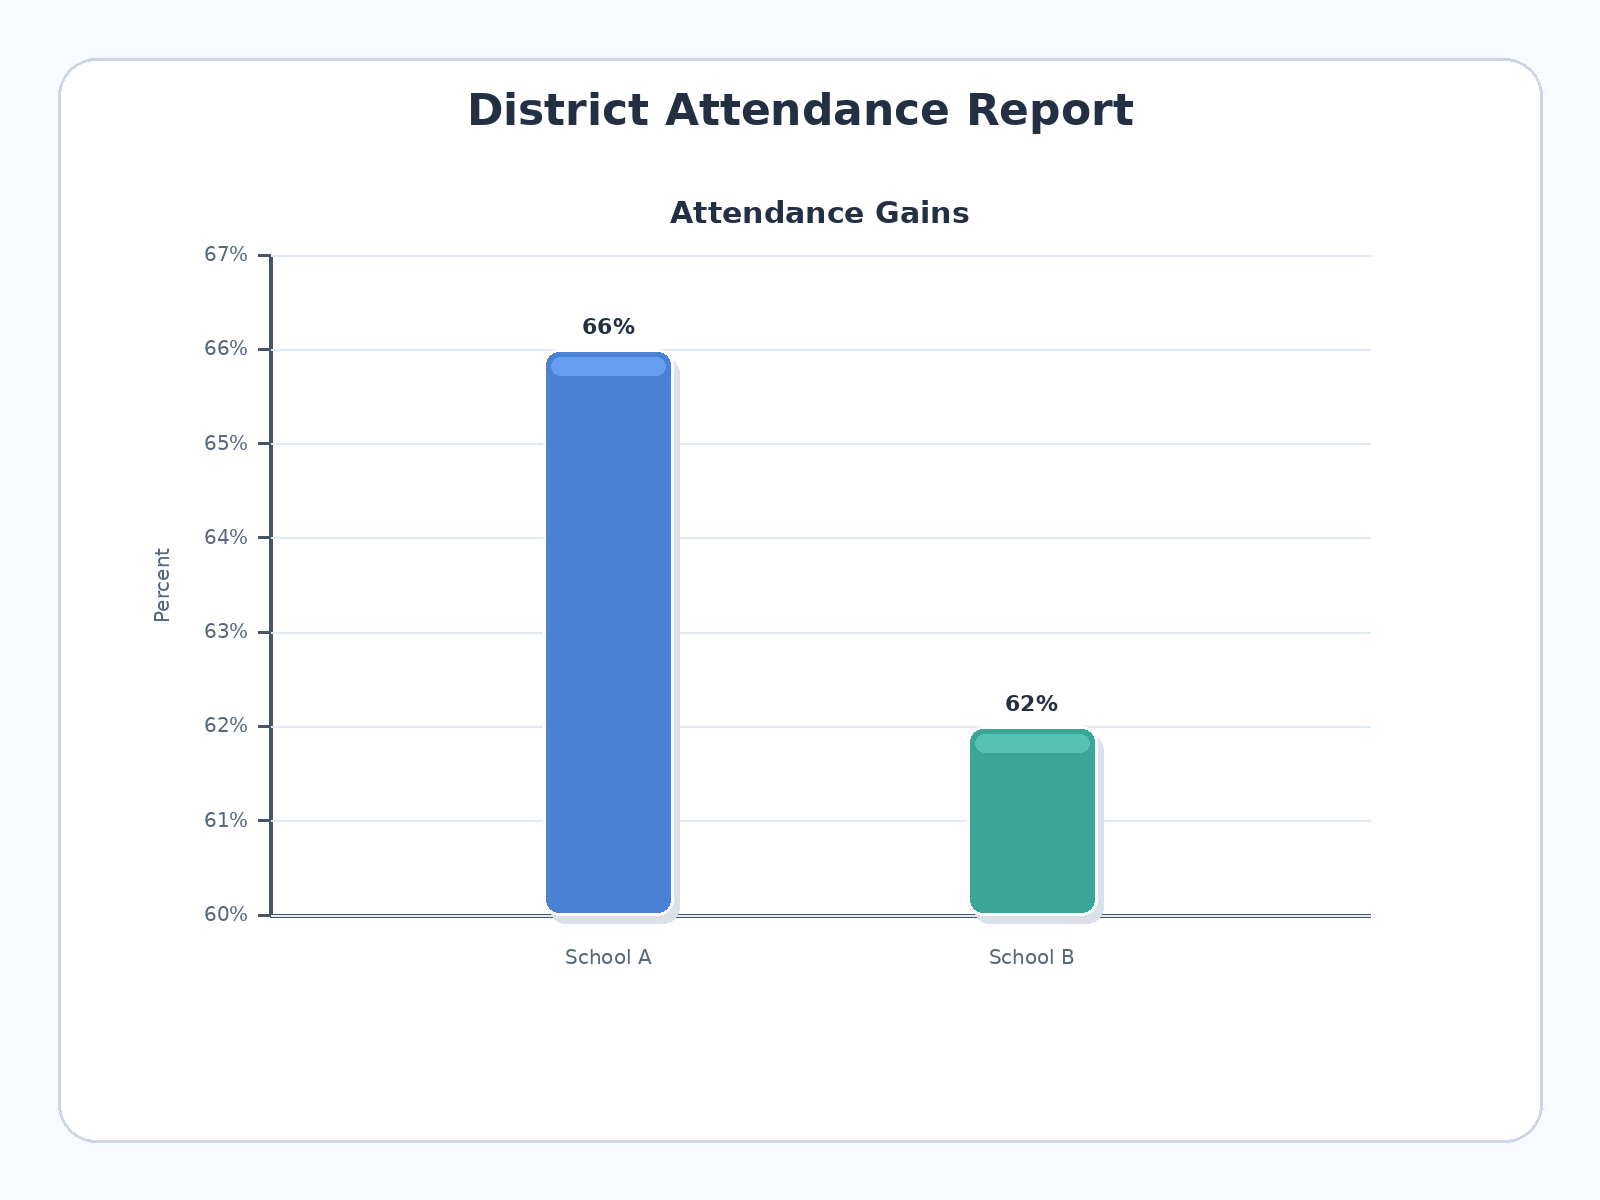
A district report claims, 'Attendance gains were far stronger in School A than in School B.' The graph shows School A at 66% and School B at 62% on a y-axis from 60% to 67%, and the report does not say how many students were in each group. Which answer best explains why readers should be cautious?