5.164 Interpret Bar Graphs and Line Graphs with Multi-Step Questions
0%
Skill Level🔴 Hard
00:00
Progress to Next Level25% to Medium
EasyMediumHardMastery100%
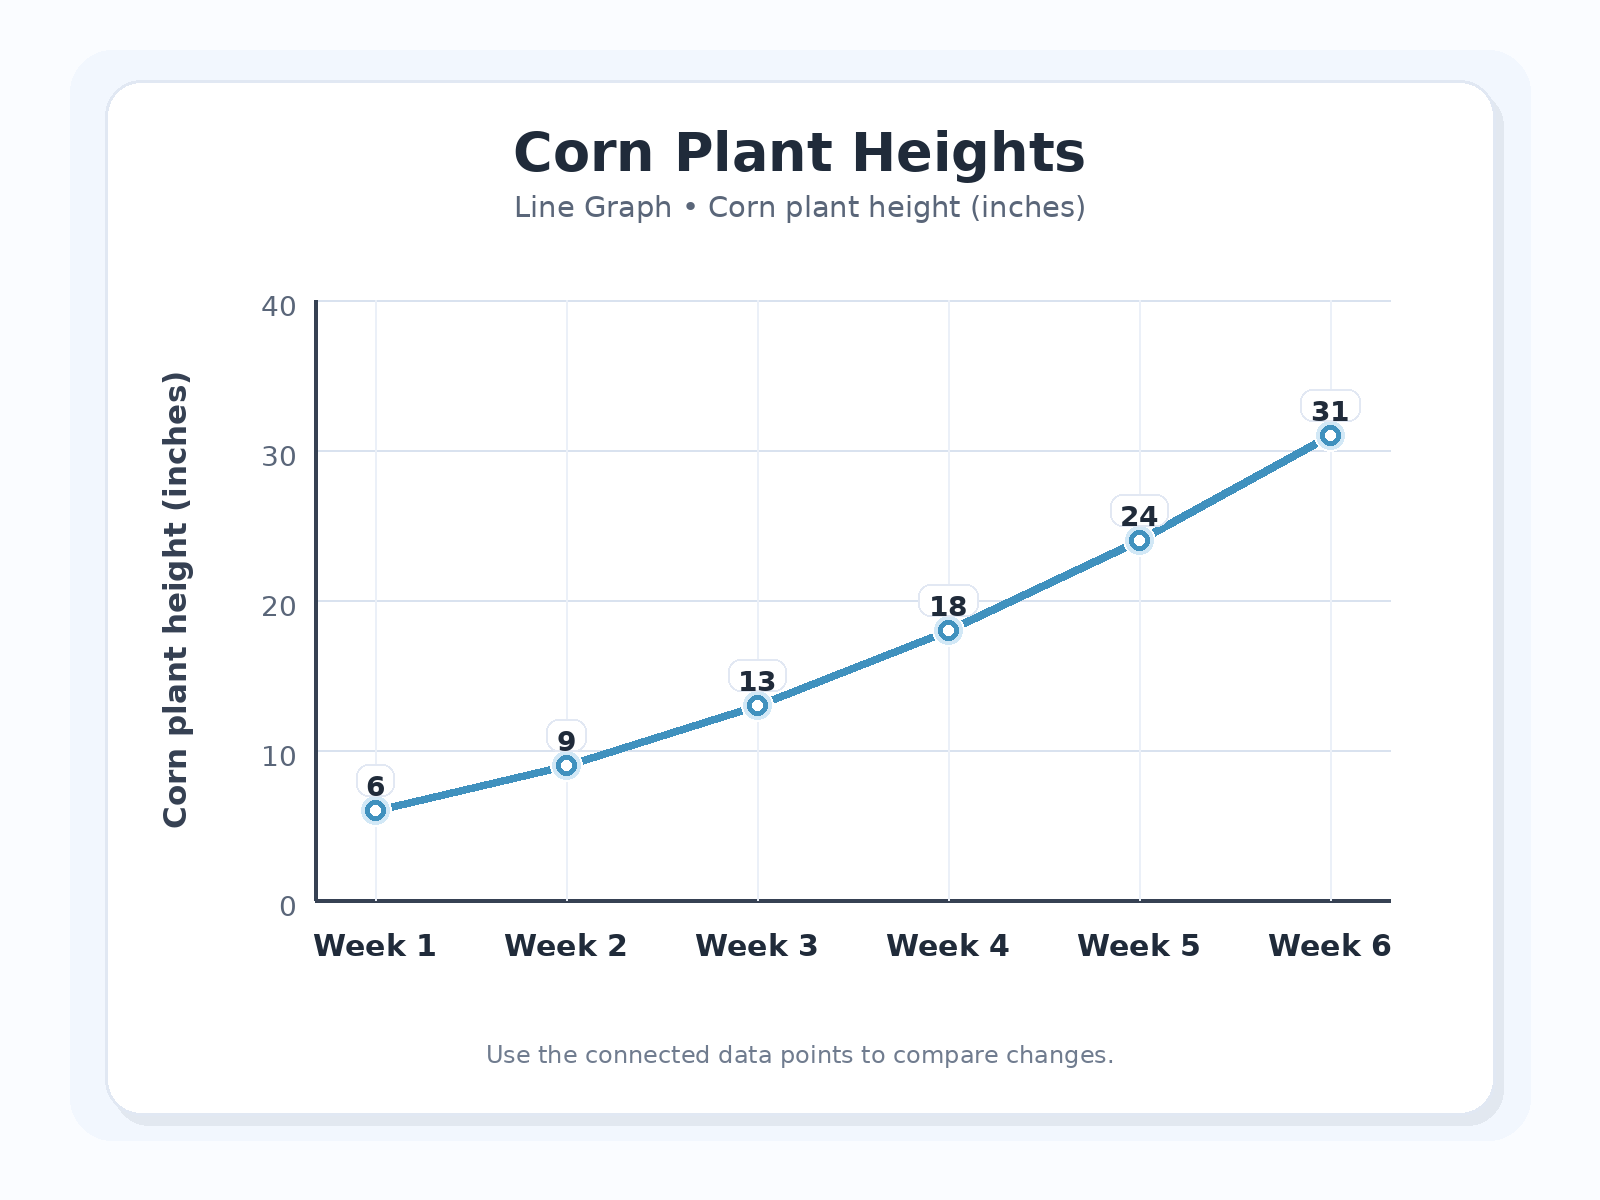
A line graph titled 'Corn Plant Heights' shows corn plant heights in inches. Data: Week 1 = 6; Week 2 = 9; Week 3 = 13; Week 4 = 18; Week 5 = 24; Week 6 = 31. What is the difference between the total growth in the first three intervals and the total growth in the last two intervals?