6.12 Graph Equivalent Ratios and Recognize Proportional Lines
0%
Skill Level🔴 Hard
00:00
Progress to Next Level25% to Medium
EasyMediumHardMastery100%
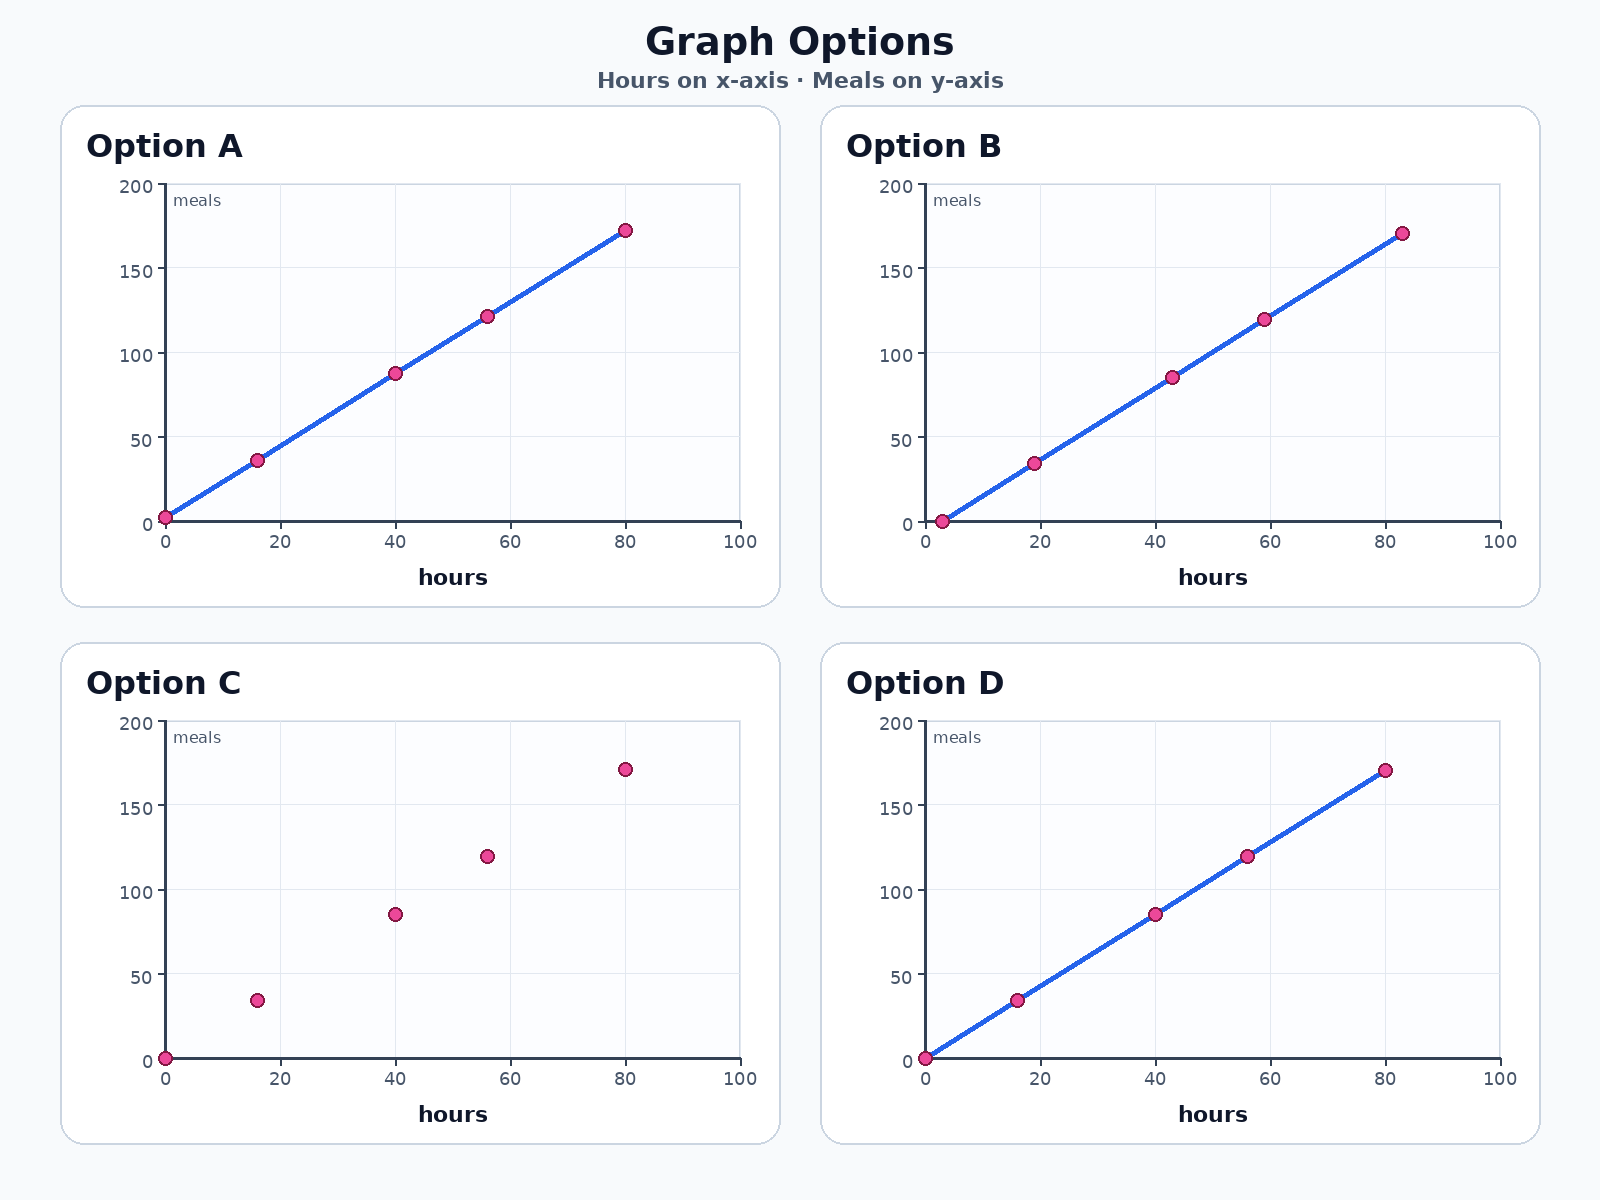
A class is checking a graph of a ratio table for hours of volunteering and meals packed. The table shows hours values 16, 40, 56, 80 and meals values 34, 85, 119, 170. Which graph shows a proportional relationship?