Skip to content
free
K
1
2
practice
Home
Math
English
Science
Social Studies
Contact
Language
English
Español
Sign In
/
Math
/
Grade 7
/
Dot plots and line plots
Worksheet
Grade Level
Grade 7
7.124 Dot plots and line plots
0%
Skill Level
🔴 Hard
00:00
Progress to Next Level
25% to Medium
Easy
Medium
Hard
Mastery
100%
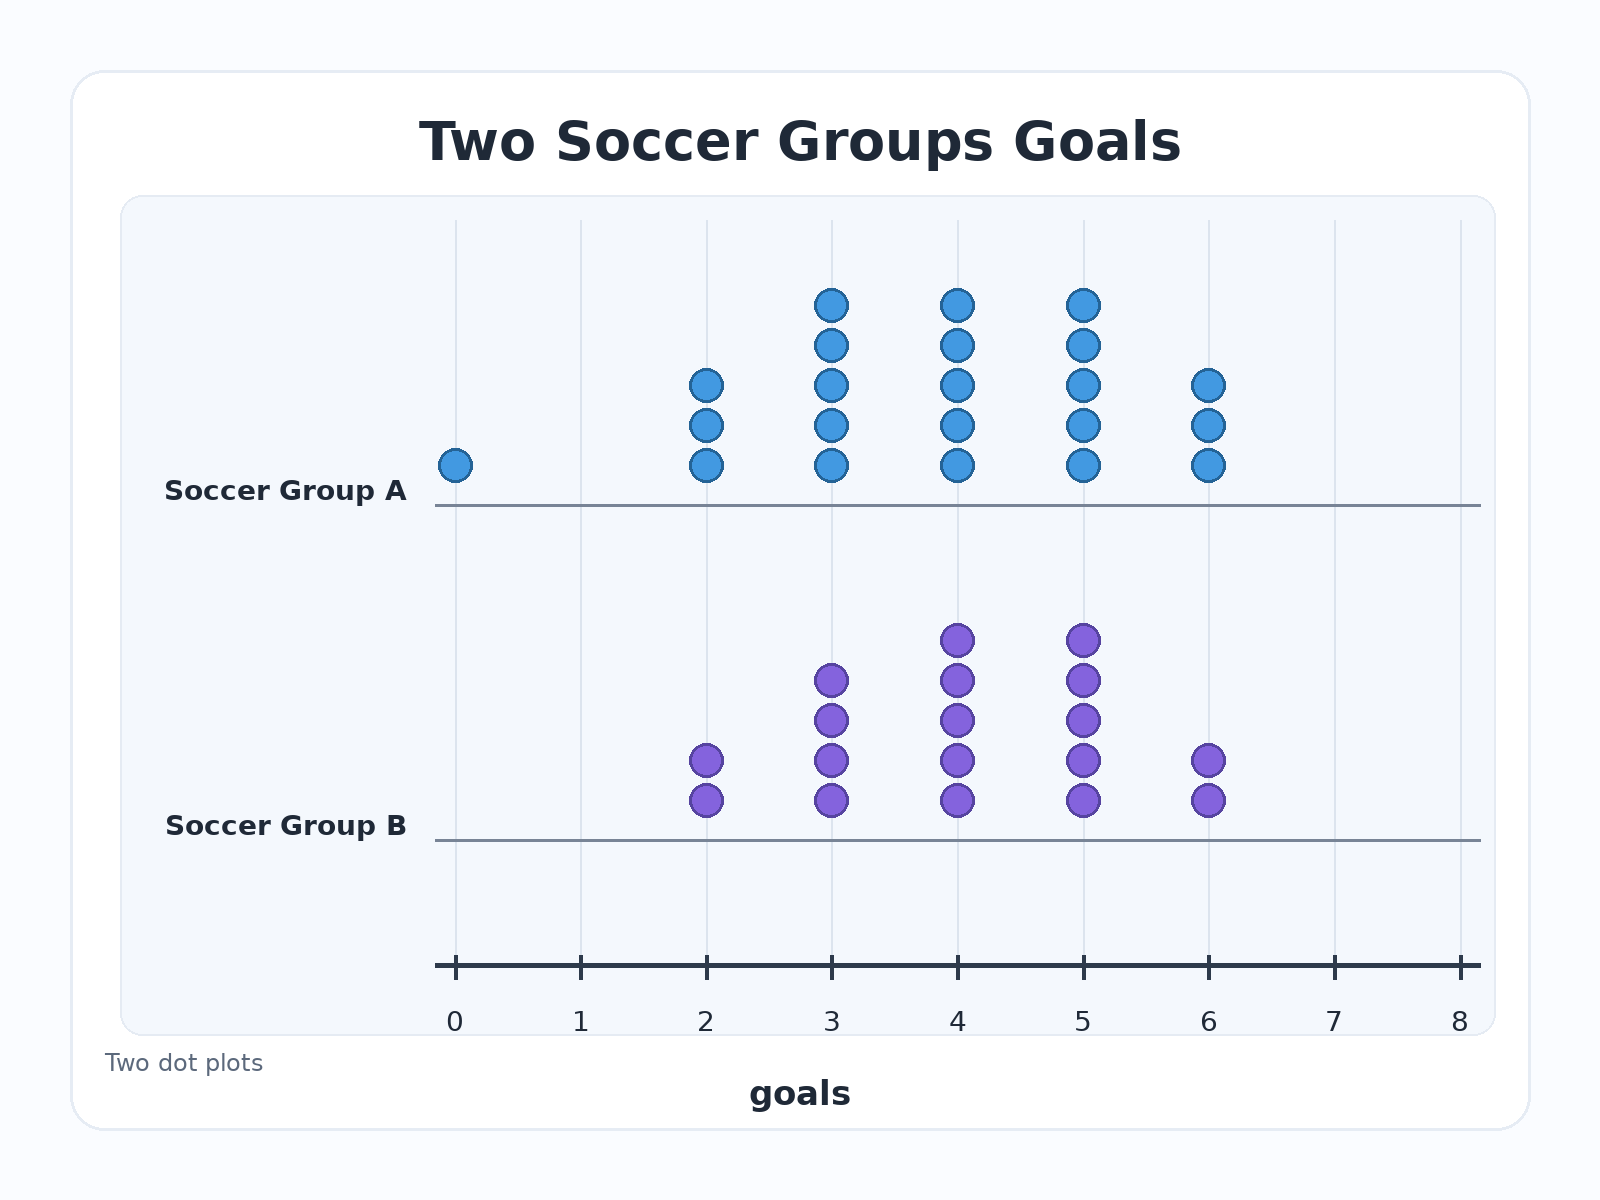
Look at the two dot plots titled 'Two Soccer Groups Goals'. Which conclusion about the outlier and spread is correct?
A
Soccer Group A has no unusual value because every mark is in the main cluster.
B
The possible outlier makes Soccer Group A's values less spread out.
C
Soccer Group B must have the outlier because its marks are closer together.
D
Soccer Group A has a possible outlier at 0 goals, which increases its spread.
Submit Answer