Pre-CAL.188 Estimate Limits Graphically Using Zoom and Trace
0%
Skill Level🔴 Hard
00:00
Progress to Next Level25% to Medium
EasyMediumHardMastery100%
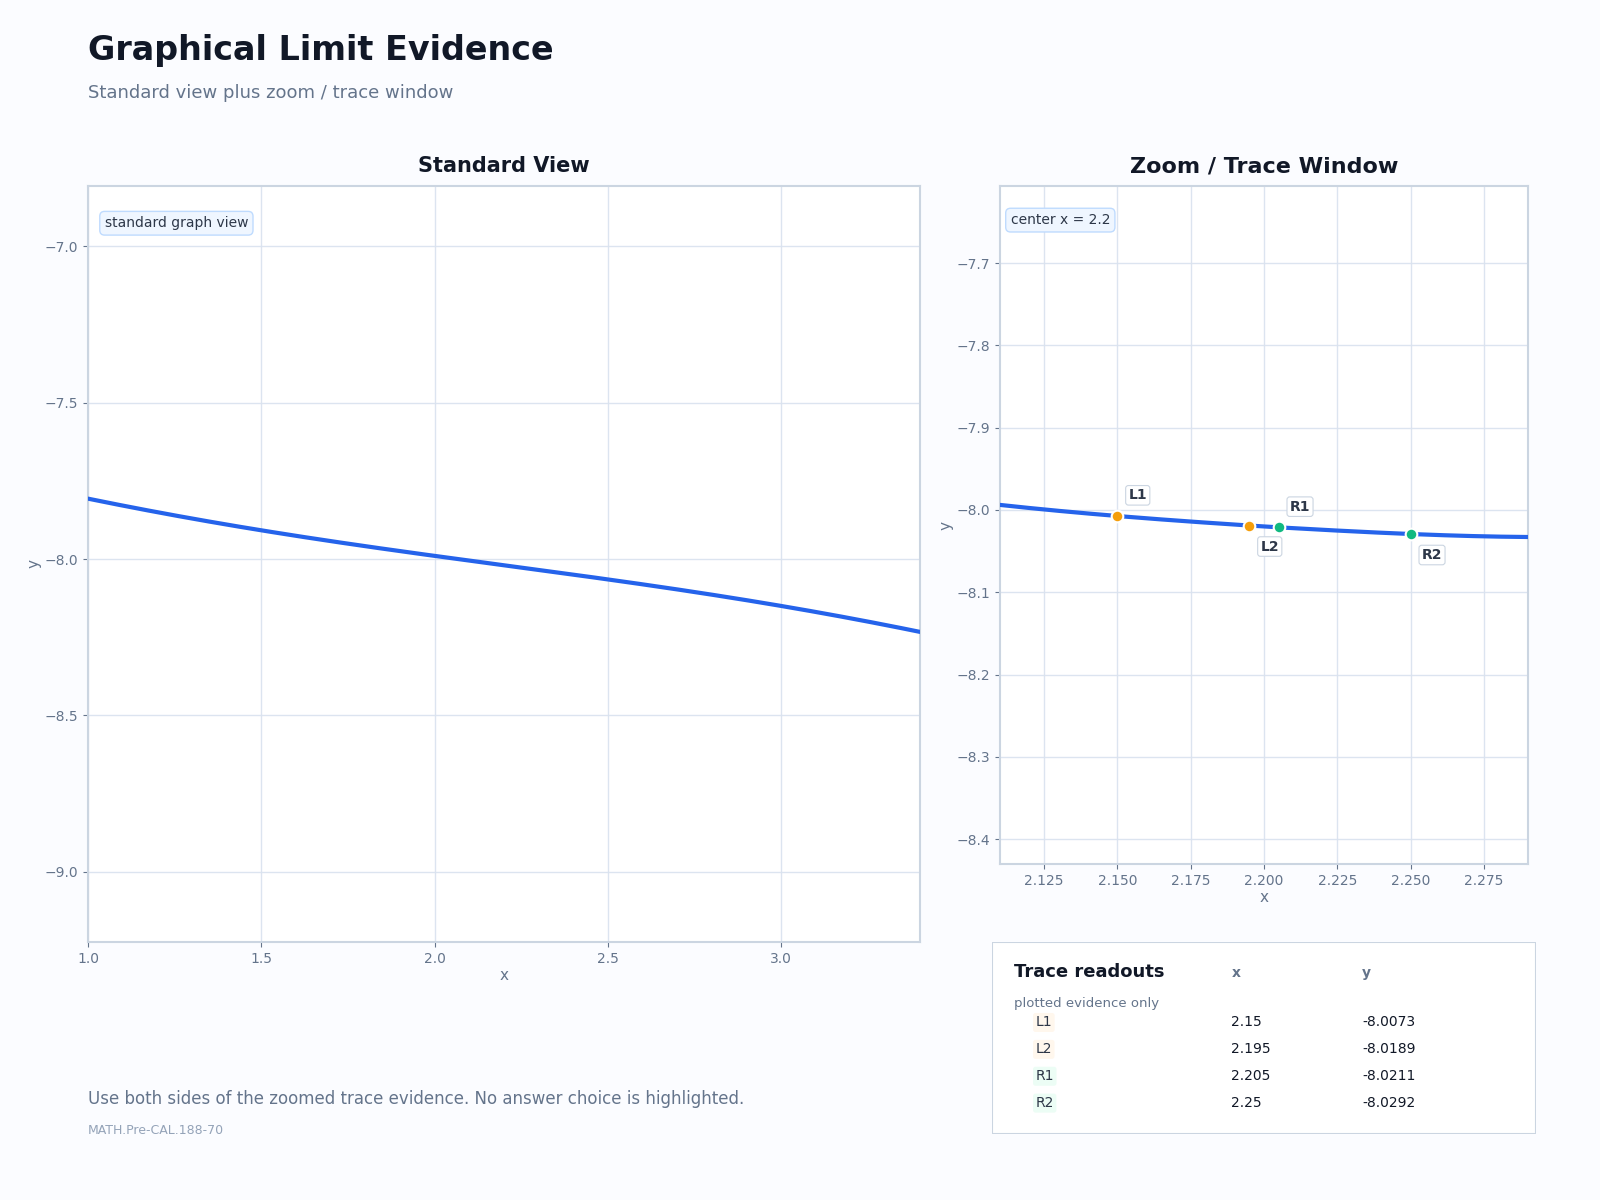
A calculator-style graph shows trace points approaching x = 2.2 from both sides. Left trace: (2.15, -8.0073), (2.195, -8.0189). Right trace: (2.205, -8.0211), (2.25, -8.0292). The zoomed curve remains connected through the trace window. Which conclusion follows from the graph?