Pre-CAL.192 Interpret Area Under a Curve in Context
0%
Skill Level🔴 Hard
00:00
Progress to Next Level25% to Medium
EasyMediumHardMastery100%
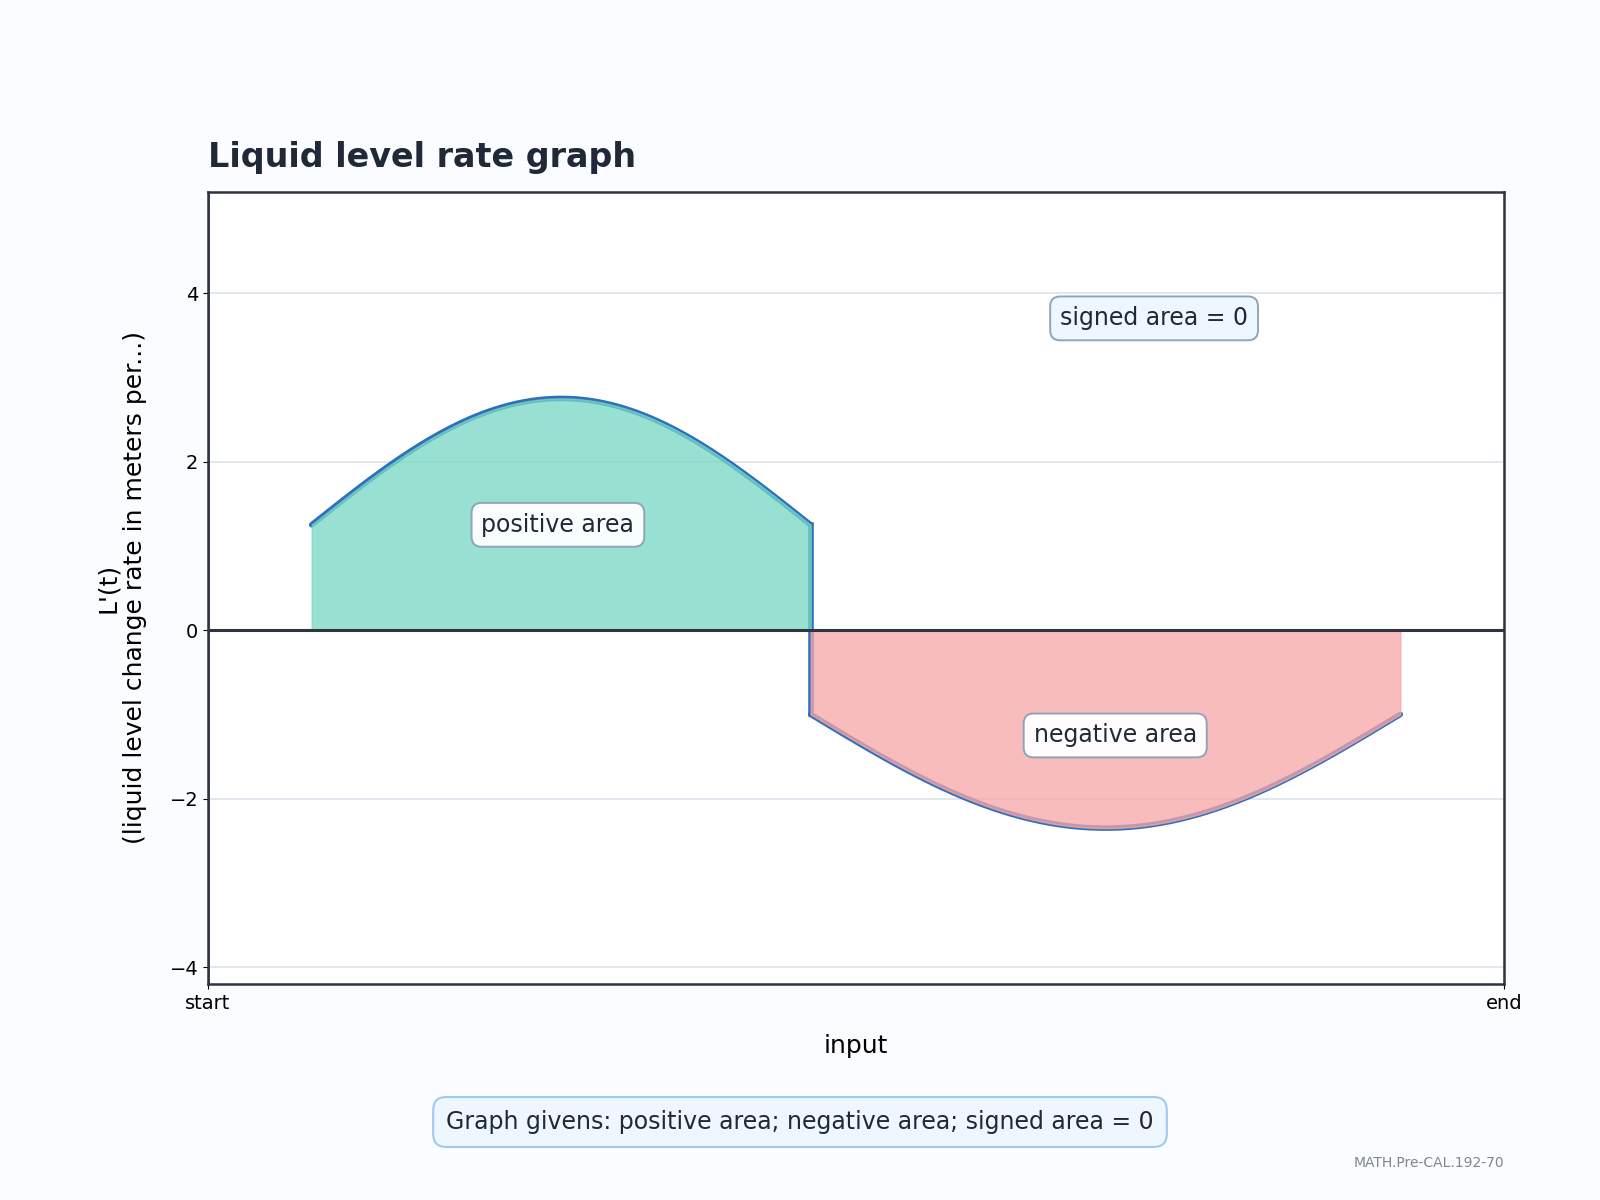
A graph of L'(t), liquid level change rate in meters per hour, has signed area 0 over an interval, but the graph is sometimes above and sometimes below the axis. What does the signed area mean?