Pre-CAL.164 Residuals and Goodness of Fit
0%
Skill Level🔴 Hard
00:00
Progress to Next Level25% to Medium
EasyMediumHardMastery100%
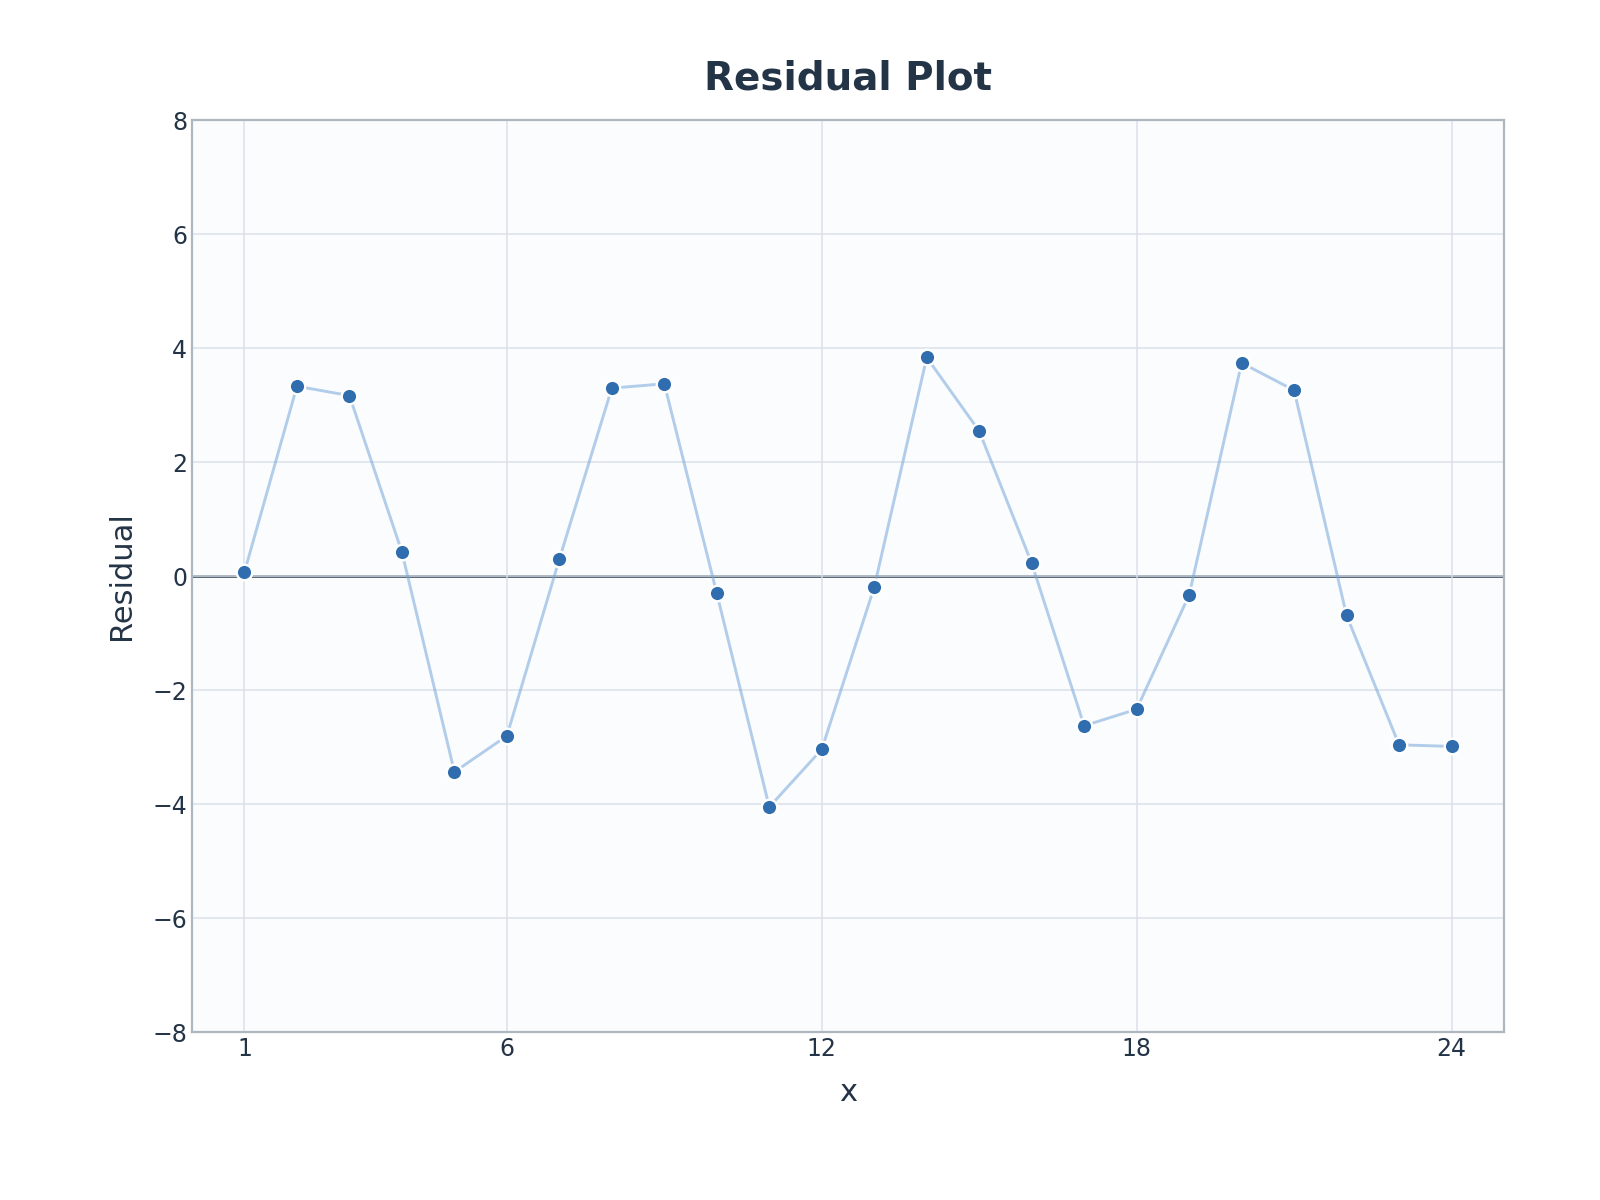
A quadratic model is fit to data that actually vary in a repeating cycle. The residual plot is shown with a wave pattern around 0. What is the best interpretation?