TRIG.71 Use trigonometric graphs to estimate solutions to equations and inequalities
0%
Skill Level🔴 Hard
00:00
Progress to Next Level25% to Medium
EasyMediumHardMastery100%
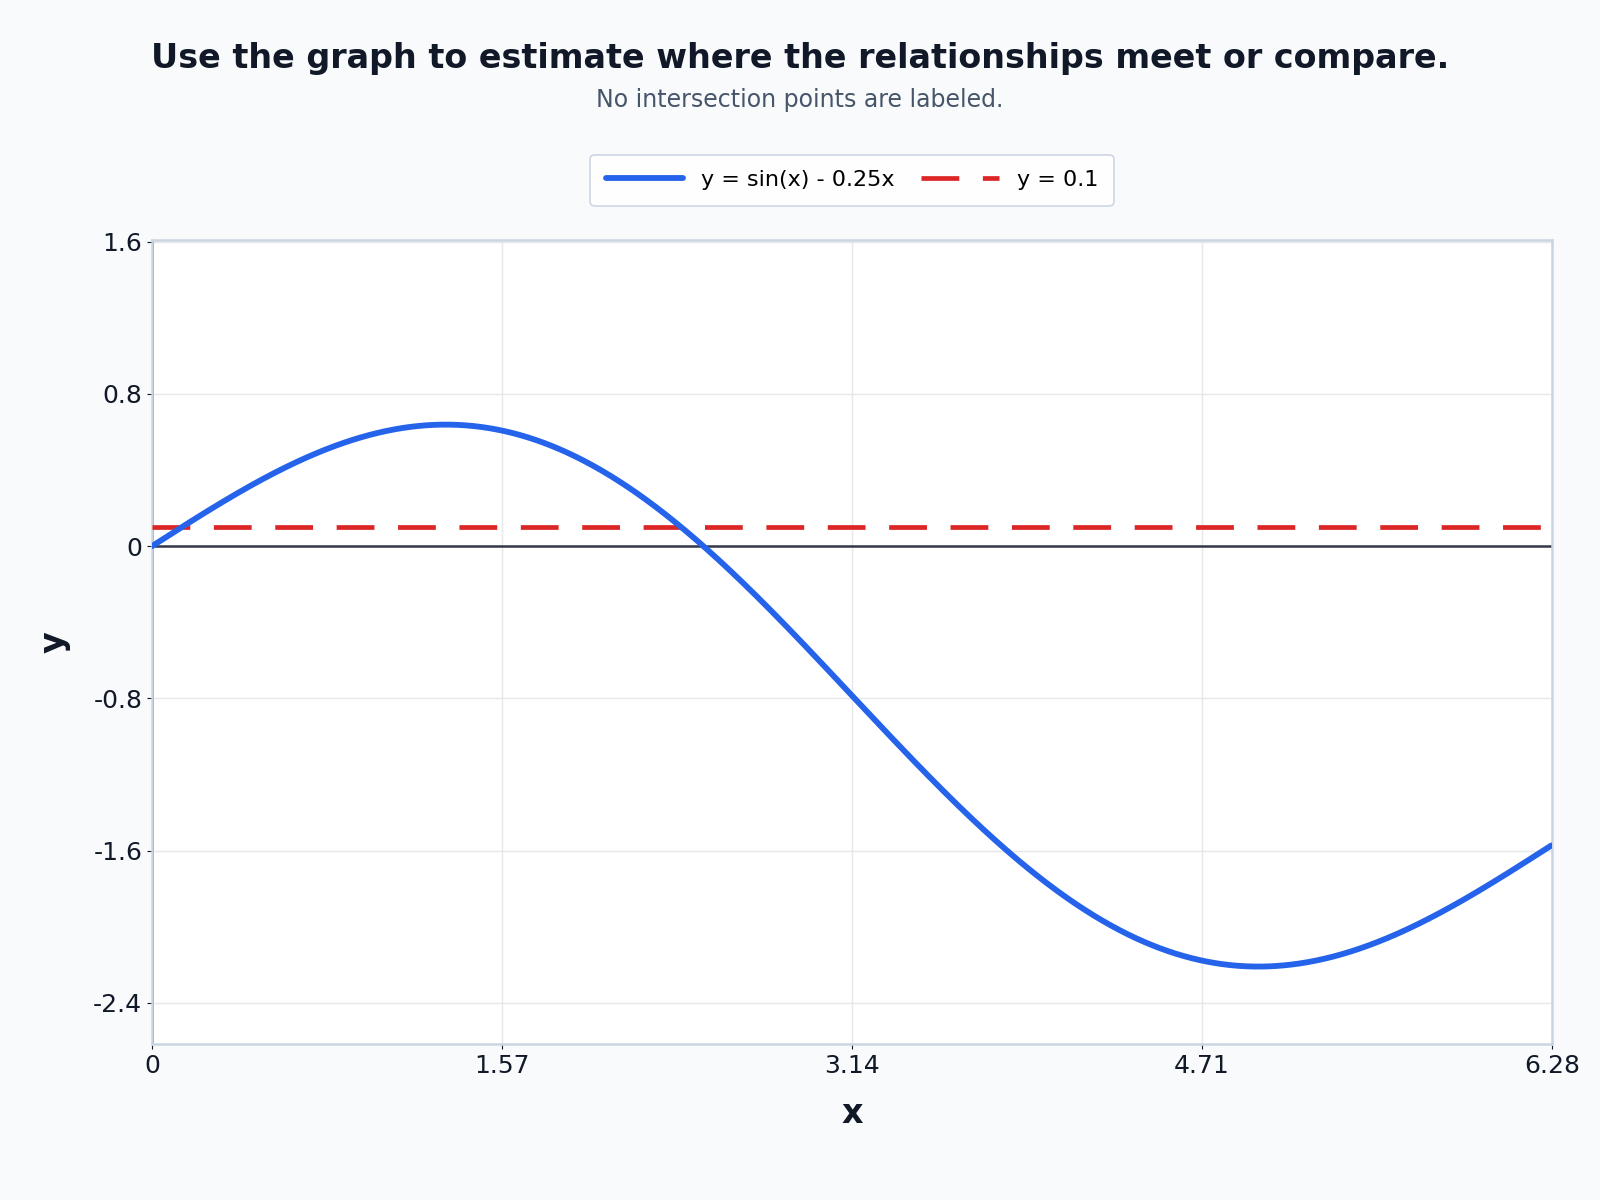
Use the graph showing y = sin(x) - 0.25x and the horizontal line y = 0.1 on 0 <= x <= 6.28 to estimate the solution interval(s) for sin(x) - 0.25x >= 0.1. Which option best describes the solution set?